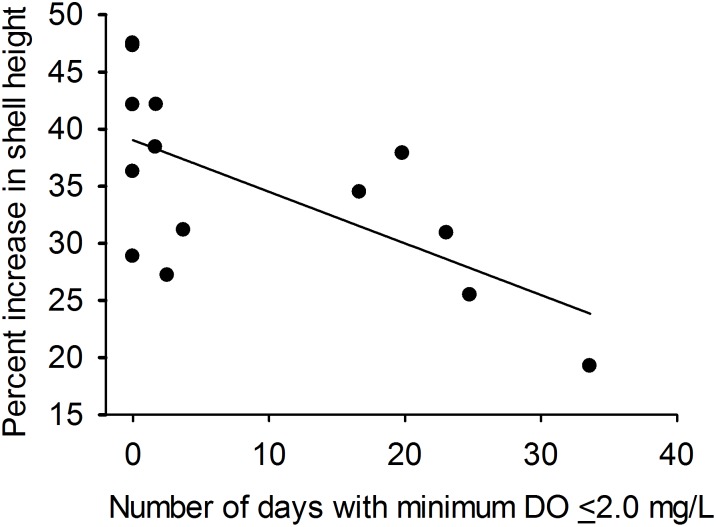
Fig 5. Percent increase in the shell height (GROW) of initially-uninfected (1yo) oysters versus the percentage of days with minimum DO concentration ≤ 2.0 mg l-1 (HYP) across 14 experiment deployment locations in Chesapeake Bay during 2008 and 2009.
Regression line: GROW = 39.03–0.45*HYP, r 2 = 0.41, P = 0.01, n = 14.

