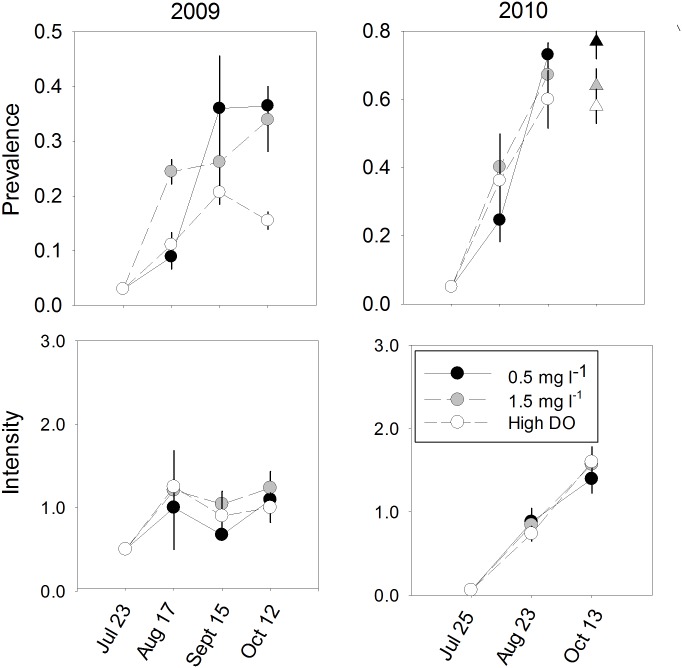
Fig 6. Prevalence and intensity of P. marinus infections in 1yo oysters in laboratory experiments (mean ± SE).
Circles are means calculated from unadjusted data; triangles for 2010 1yo oysters show 13 October lsmeans for data adjusted for infection intensity in paired tanks containing 3yo oysters. Only infected individuals (i.e., Mackin score of 0.5 or greater) were included in intensity calculations.

