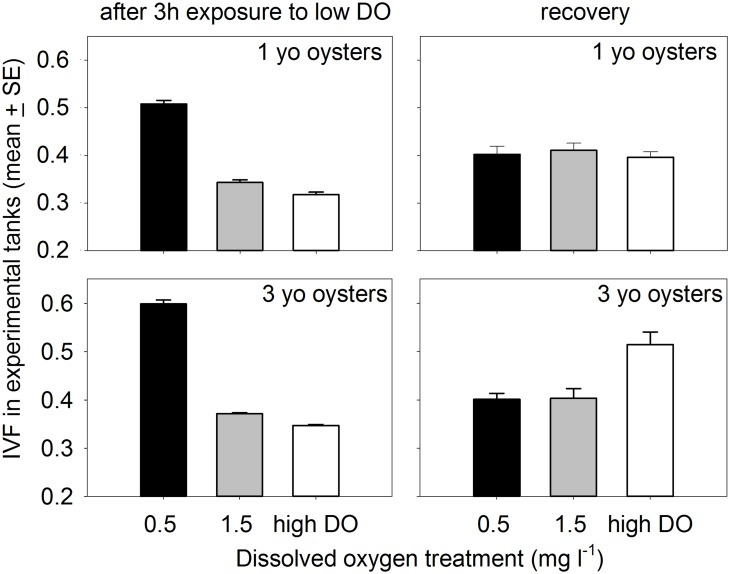
Fig 7. IVF measurements in 2010 experimental aquaria during the low DO phase of the cycle, and in separate 20-L containers towards the end of the recovery phase.
For measurements during the low DO cycle, multiple measurements in tanks are averaged and the graphed data represent the grand means of individual tank means.

