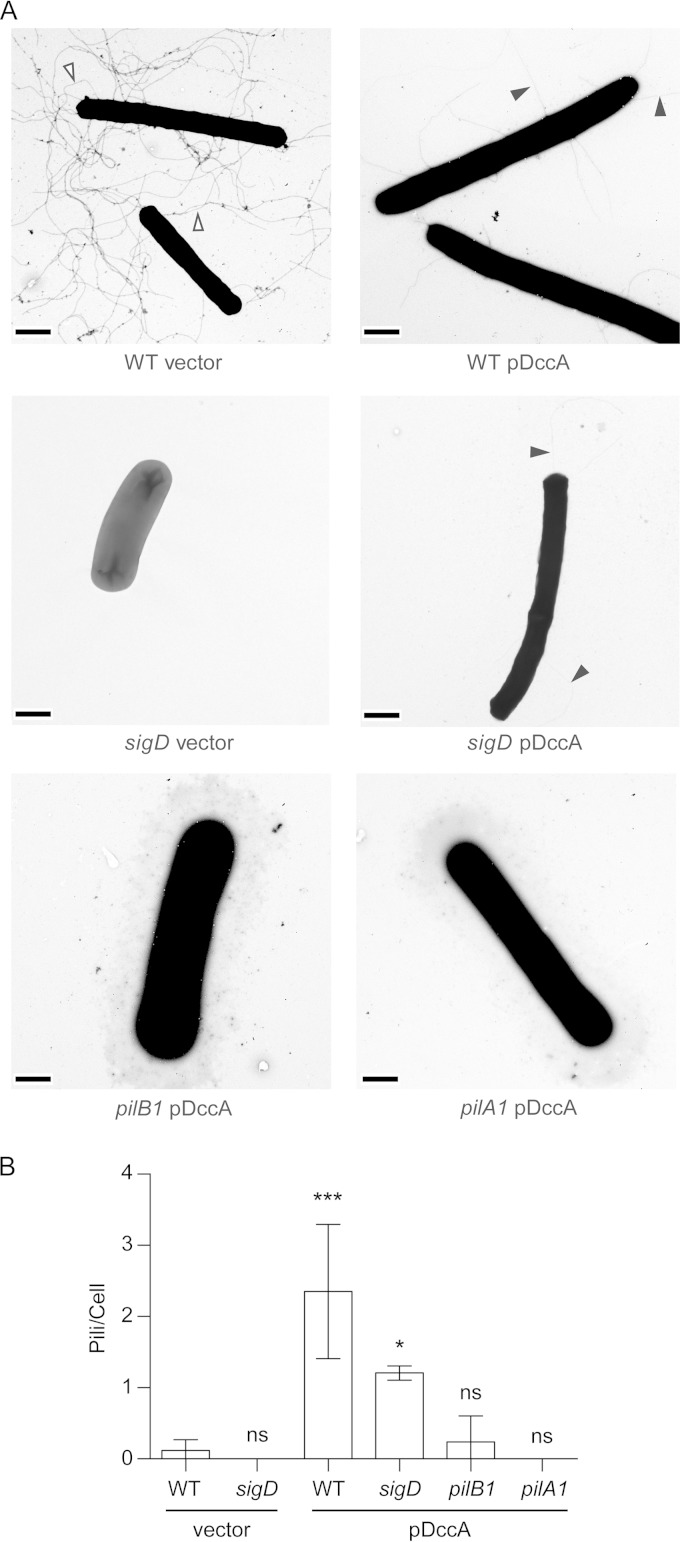
FIG 2.
c-di-GMP induces T4P formation. (A) Transmission electron microscopy of the C. difficile 630 Δerm strain (WT) or its sigD mutant with pDccA or the empty vector and the pilB1 and pilA1 mutants with pDccA from 12-h static liquid cultures in BHIS-tm with nisin (1 μg/ml). Scale bars = 1 μm. Open arrowheads show flagella and closed arrowheads show pili. (B) Mean number of pili for each cell in 15 (WT), 20 (pilA1 and pilB1), or 50 (sigD) randomly selected grid squares photographed at a magnification of ×8,000. The images were blinded for quantification as described in the text. Data were analyzed by one-way analysis of variance (ANOVA) and Dunnett's multiple-comparison test comparing values to those for the WT strain with the empty vector (ns, P > 0.05; ***, P < 0.001; *, P < 0.05).

