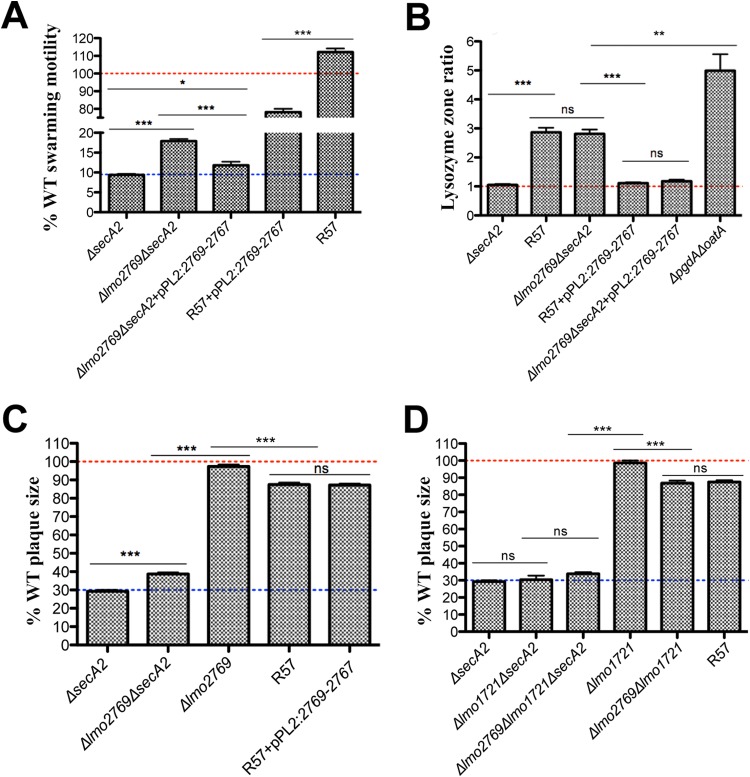
FIG 4.
Characterization of an lmo2769 mutant in a ΔsecA2 background. (A) Swarming motility of mutants and strains complemented with the lmo2767 operon was assessed on semisolid LB agar following incubation at 30°C after 48 h. Motility is expressed as a percentage of the swarming area of the WT strain and set at 100% (represented by a red dotted line). Error bars represent standard deviations of the mean zone ratios from three independent experiments. (B) Disk diffusion susceptibility to 1 mg of lysozyme expressed as a ratio of the WT. Error bars represent standard deviations of the mean zone ratios. (C and D) Plaque area of each mutant is shown as a percentage of that of the WT strain, set at 100% (represented by a red dotted line). Error bars represent standard deviations of the mean plaque size ratios from three independent experiments. Student's t test was used to analyze statistical significance: ***, P < 0.0001; **, P < 0.01; *, P < 0.05; and ns, P ≥ 0.05.

