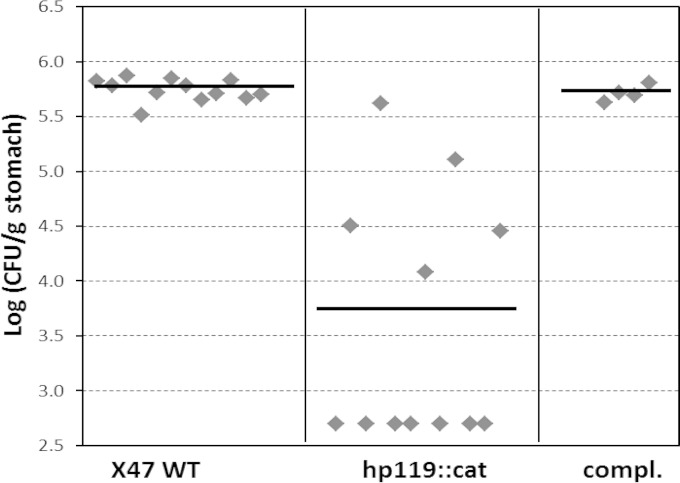
FIG 3.
Mouse colonization results of H. pylori strains. The mice were inoculated with H. pylori at a dose of 1.5 × 10⁸ viable cells per animal. Colonization of H. pylori in mouse stomachs was examined 3 weeks after the inoculation. Data are presented as a scatter plot (log scale) of CFU per gram of stomach as determined by plate counts. Each point represents the CFU count from one mouse stomach, and the horizontal bars represent the geometric means of the colonization numbers for each group. The detection limit of the assay is 500 CFU/g stomach, corresponding to a log10 (CFU/g) of 2.7.

