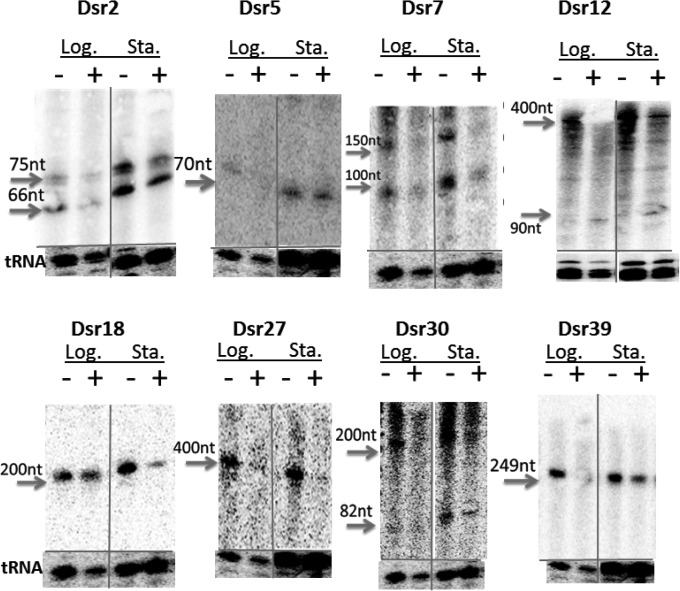
FIG 6.
Differential expression of selected sRNAs. In each Northern blot image, the left two lanes are RNA samples from exponential-phase (OD600 = 1) cells, and the right two lanes are from stationary-phase (OD600 = 3) cells. The first and third lanes are the control (sham irradiation) RNA samples, and the second and fourth lanes are the 15-kGy-irradiated RNA samples. The images of first two lanes and the last two lanes are cut from the same gel in different parts. The band intensity change of each candidate is normalized to the tRNA levels shown at the bottom of each blot. All the blots shown here have either a 2-fold decrease in activity after irradiation (Dsr2, Dsr5, Dsr7, Dsr18, Dsr27, Dsr30, and Dsr39) or a 2-fold increase in activity after irradiation (Dsr12).

