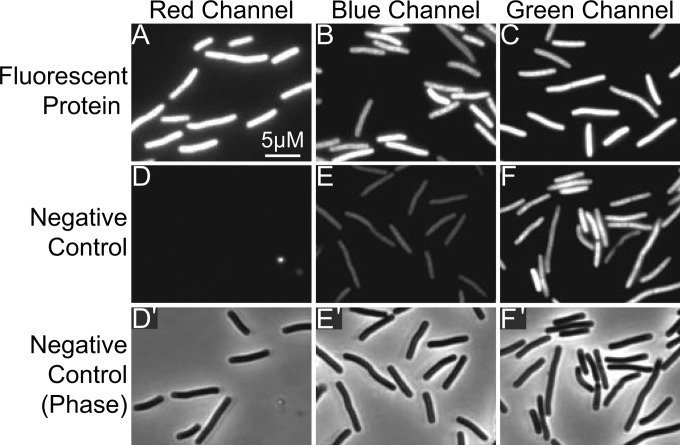
FIG 2.
Comparison of fluorescent proteins and autofluorescence. The top row of micrographs shows C. difficile exconjugants producing mCherryOpt from pDSW1728 (A), CFPopt from pRAN334 (B), or GFPmut2 from pRAN332 (C). Cells were photographed using filters appropriate for each protein as indicated above the images. The middle row shows C. difficile carrying pRPF185, which does not produce any fluorescent protein, photographed with the same filter sets (D, red; E, blue; F, green). The bottom row shows phase-contrast micrographs corresponding to images D to F.

