
FIG 2.
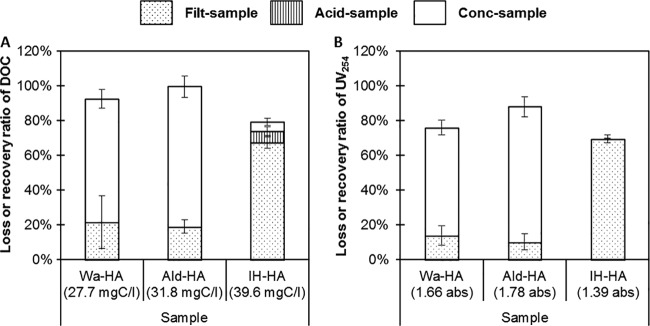
Loss or recovery efficiencies of DOC (A) and UV254 (B) in raw samples of humic acid solutions during the virus concentration process. The values indicate the concentrations in each raw sample. The error bars indicate standard deviations (n = 3).