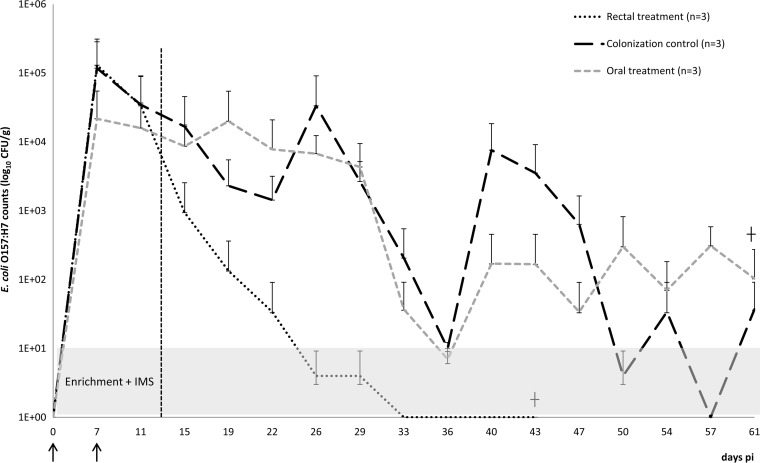
FIG 2.
Results are presented as the mean real values of CFU/g feces + SD on a logarithmic scale. A value of 1E+00 corresponds to negative sampling after enrichment and IMS. The vertical dashed line at day 11 indicates the start of the treatment. The arrows indicate the starts of the first and second infections.

