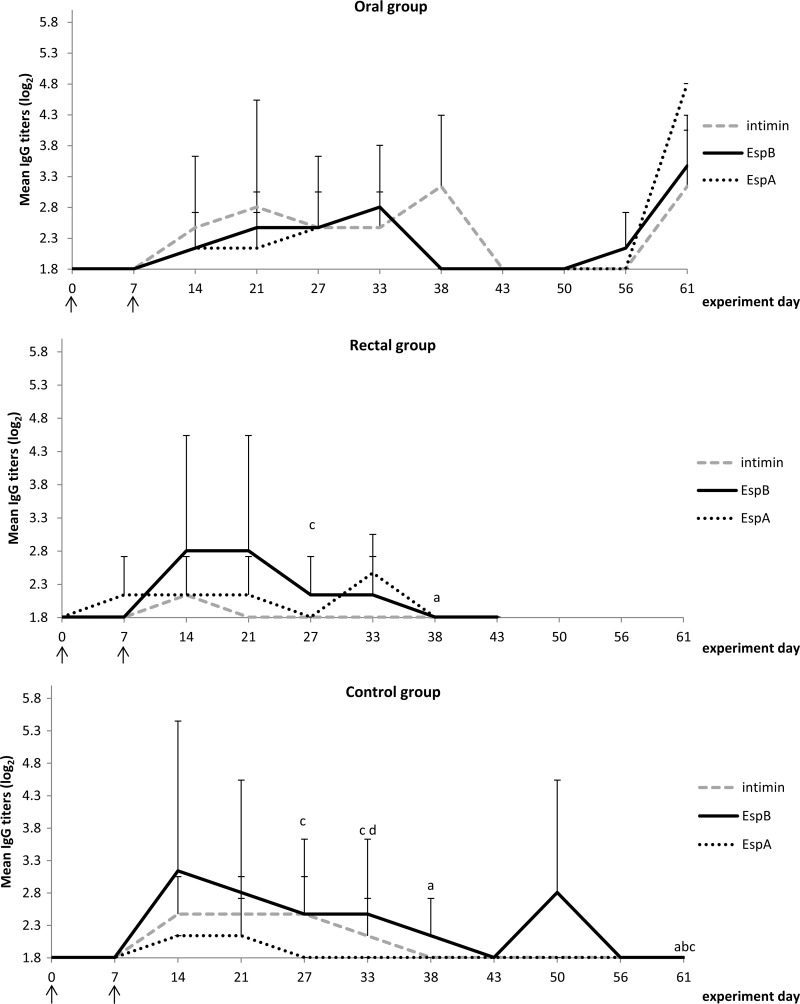
FIG 3.
Mean IgG titers (log2) for the 3 treatment groups. Letters indicate a significant difference between groups for a designated time point: a, significant differences in intimin responses compared to the oral group; b, significant differences in EspB responses compared to the oral group; c and d, significant differences in EspA responses compared to the oral group (c) and to the rectal group (d). Arrows indicate the time points of oral inoculation with bacteria.

