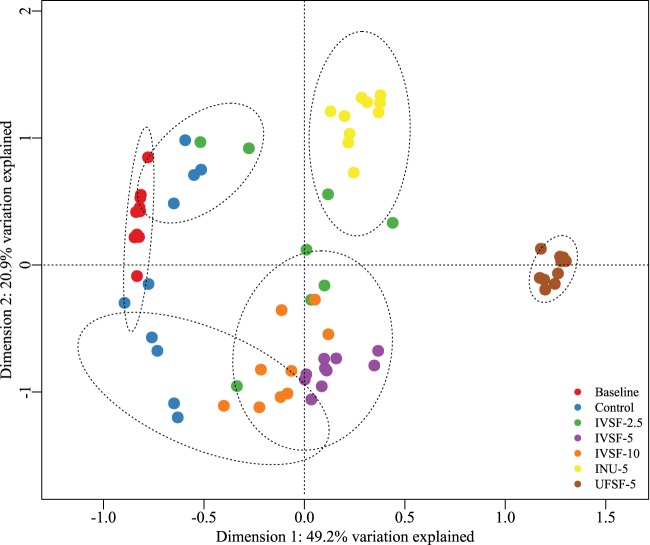
FIG 4.
Constrained analysis of a principal coordinates plot on normalized bacterial reads at the species level using Bray-Curtis dissimilarities. The k-means method was used for clustering (clusters include a 95% confidence interval). DNA from 24-h in vitro fermentations of IVSF at 2.5 to 10 mg/ml, INU-5, or UFSF-5 was sequenced. Data are for 9 to 10 fermentations in each group.

