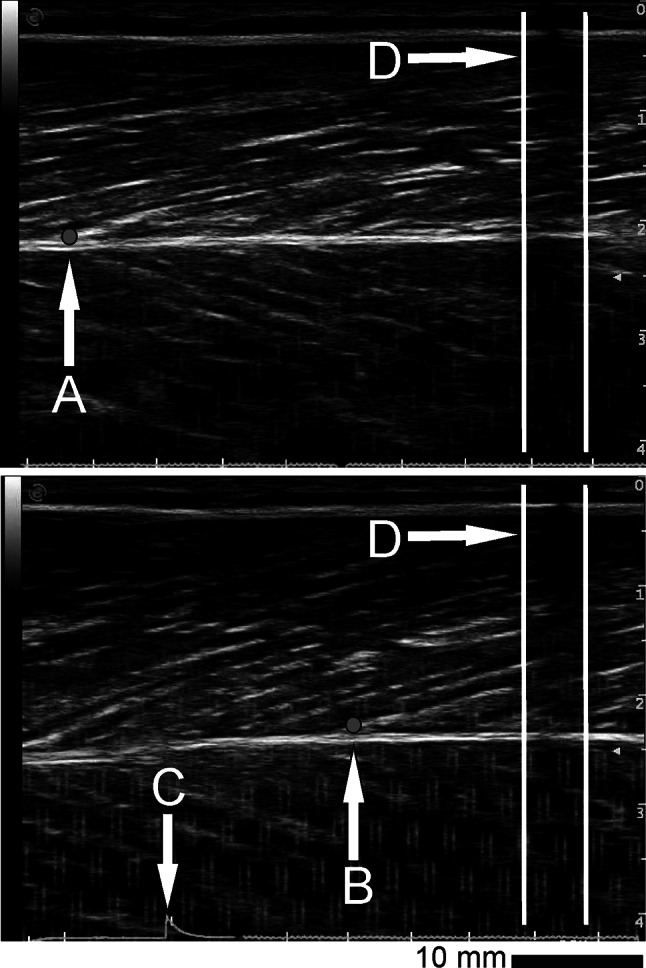
Fig. 3.

VL fascicle insertion point on the deep aponeurosis at rest upper image (a), and during an isometric MVC lower image (b). Synchronization signal is displayed as spike in the bottom of the image (c). We calculate the displacement of the insertion point in relation to the skin marker here visible as vertical hypoechoic area (d)
