
Figure 6.
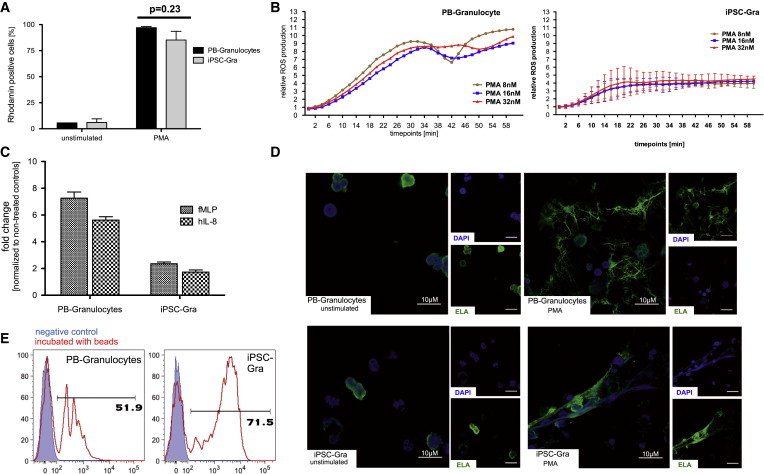
Functional Characterization of iPSC-Gra
(A) Dihydrorhodamine (DHR) assay measuring the production of reactive oxygen species (ROS) after activation with phorbol myristate acetate (PMA) in PB-Gra or iPSC-Gra by flow cytometry (n = 3 of independent experiments; mean ± SEM).
(B) Time dependence of ROS production in PB-Gra or iPSC-Gra after PMA stimulation measured by conversion of DCFDA to luminescent DCF (n = 1 for PB-Gra; n = 2 independent experiments, mean ± SD for iPSC-Gra).
(C) Migration potential of PB-Gra or iPSC-Gra toward an fMLP or hIL-8 gradient (n = 3 independent experiments; mean ± SD). Values are given as fold change over nonstimulated cells.
(D) Confocal fluorescence microscopy of NET formation by PB-Gra (top row) or iPSC-Gra (bottom row) after stimulation with PMA. Images represent nuclear-DAPI staining (blue) and ELA staining (green), as well as overlays (scale bar, 10 μM).
(E) Phagocytosis of FITC-labeled latex beads, PB-Gra, or iPSC-Gra analyzed by flow cytometry (a representative experiment is shown; blue filled, untreated control; red, cells treated with 1 μm beads). Data are shown for hCD34iPSC16.