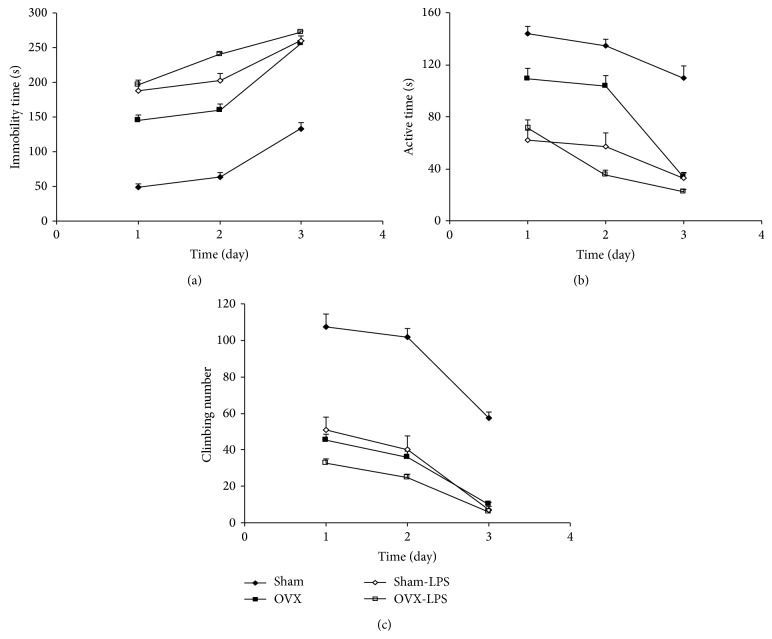
Figure 1.
Comparison of immobility times (a), active times (b), and the number of climbing (c) in the forced swimming test between four groups. Data are expressed as mean ± SEM (n = 10 in each group). The repeated measures ANOVA showed that the immobility times in the OVX group were higher while, the active times were lower than those of the Sham group (P < 0.001). The immobility times in the Sham-LPS group were higher while, the active times than those of the Sham group (P < 0.001). In OVX-LPS group, the immobility times were higher while the active times were lower than those of the OVX group (P < 0.001). The climbing number in both Sham-LPS and OVX groups were lower than that of the Sham group (P < 0.001). There were no significant differences between OVX-LPS and OVX group.

