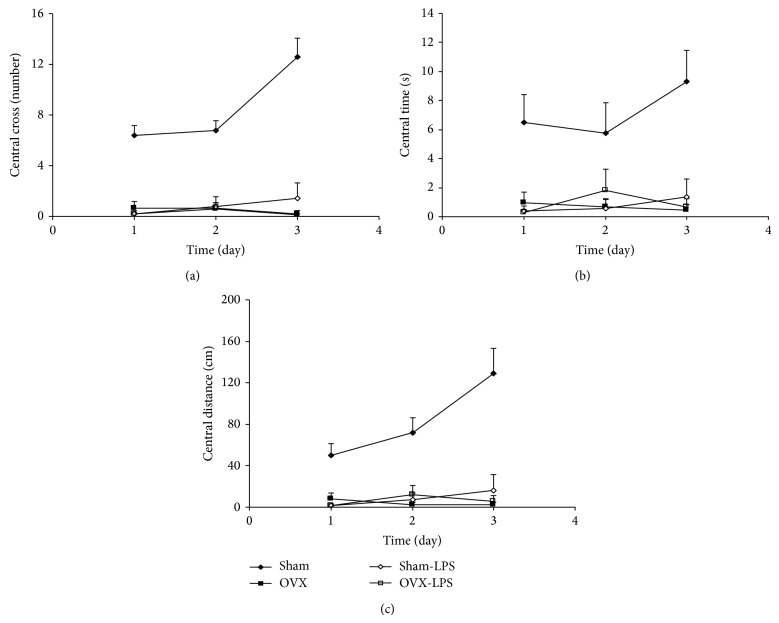
Figure 2.
Comparison of central crossing number (a), the time spent in central zone (b), and the traveled distance in central zone (c) in the open field test between four groups. Data are expressed as mean ± SEM (n = 10 in each group). The time spent and the traveled distance in the central zone in both OVX and Sham-LPS groups were lower than that of the Sham group (P < 0.001). There were no significant differences between OVX-LPS and OVX groups.

