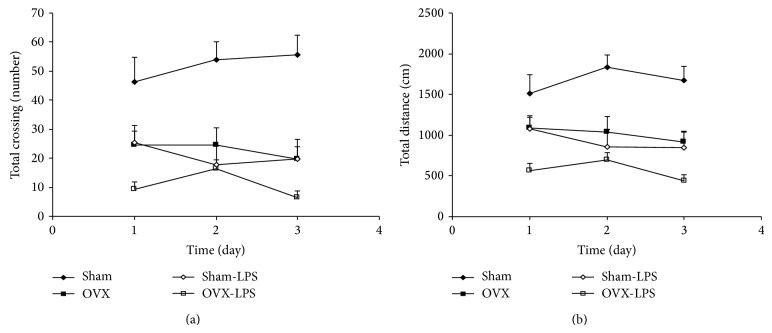
Figure 4.
Comparison of total crossing number (a) and the total traveled distance (b) in the open field test between four groups. Data are expressed as mean ± SEM (n = 10 in each group). The total number of crossing and the total traveled distance in the OVX and Sham-LPS groups were lower than that of the Sham group (P < 0.01–P < 0.001). The total crossing number and the total traveled distance by the animals of OVX-LPS group also was lower than that of OVX group (P < 0.05).

