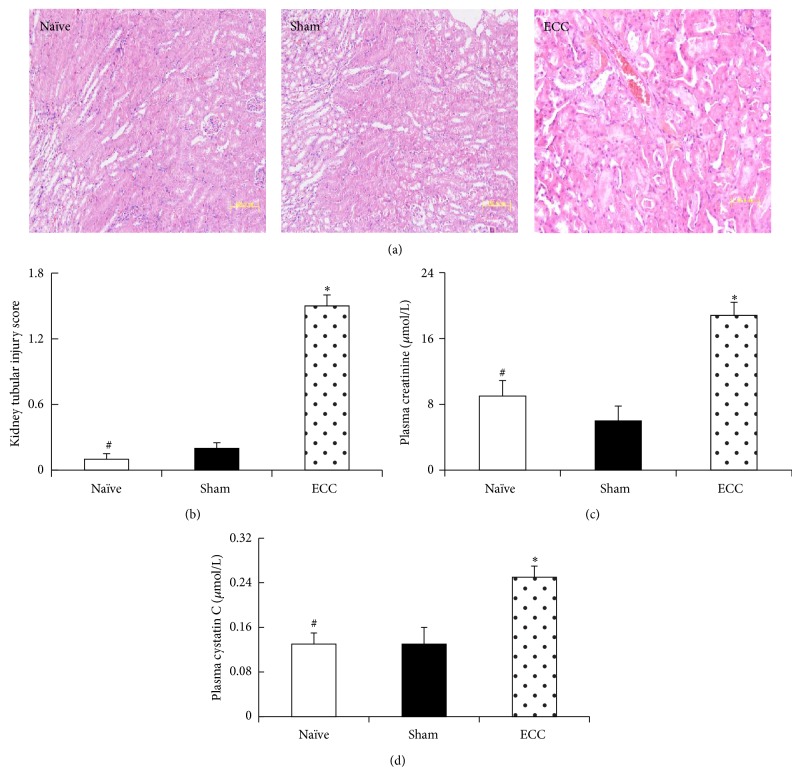
Figure 5.
Kidney function and tissue morphology after ECC. Mice were treated as described in Figure 2, and kidney histopathology and blood analysis were performed at the end of the experiment. (a) Kidney sections were stained with hematoxylin and eosin and examined by a pathologist blinded to treatment groups. (b) Extent of renal tubular injury was scored as described in Section 2 (magnification, 40x). Blood was collected from the right carotid artery to allow serum assays of (c) creatinine and (d) cystatin C. * P < 0.05 versus Sham, # P < 0.05 versus ECC.

