
Figure 3.
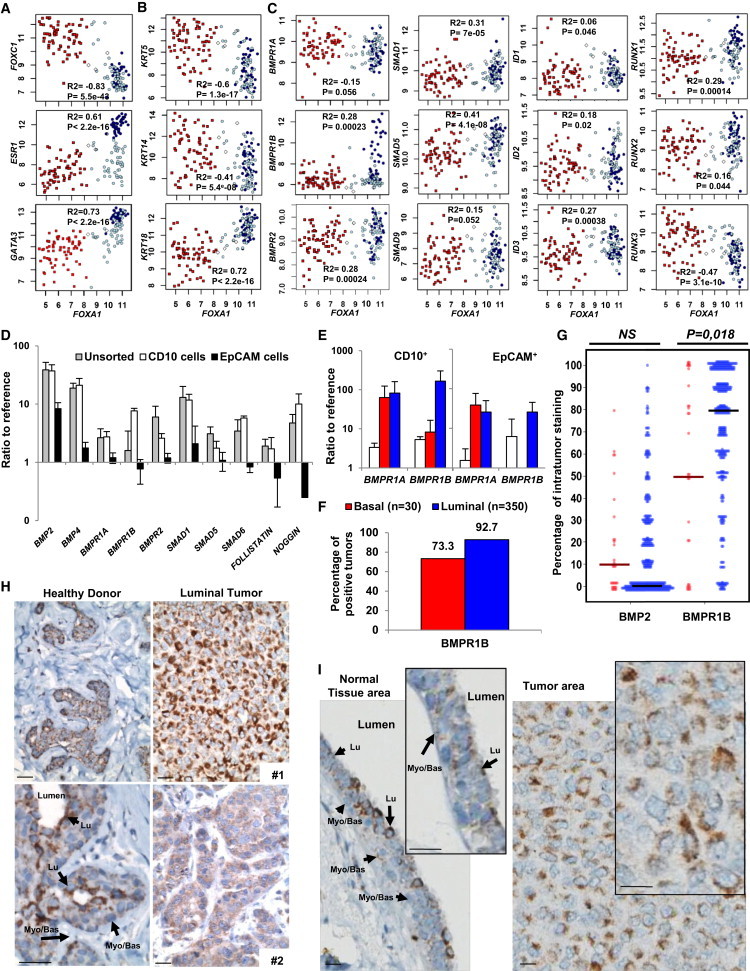
BMP2 Cooperates with IL-6 to Initiate Mammary Epithelial Cell Transformation
(A–C) Microarray analysis of normal and tumor samples for the expression of FOXA1 versus (A) FOXC1, ESR1 or GATA3; (B) KRT5, KRT14, or KRT18; (C) BMPR1A/1B/2, SMAD1/5/9, and target genes ID1/2/3 and RUNX1/2/3. White diamonds, normal samples; red squares, basal; dark blue circles, luminal; light blue circles, apocrine tumors. Pearson’s values of statistical testing R2 and p value are presented.
(D) Single cells derived from normal mammoplasties were sorted for CD10 and EpCAM, and qPCR analysis was performed for BMP signaling elements. The expression is represented as the mean ratio to reference ± SEM, n = 8.
(E) qPCR analysis of CD10+ and EpCAM+ subpopulations from normal tissue (white bars), luminal (blue bars) and basal (red bars) tumors for BMPR1A and BMPR1B. Data represent the mean ratio to reference ± SEM, n = 3. (D and E) n indicates the number of independent experiments.
(F and G) Quantification of BMPR1B IHC staining of 350 luminal and 30 basal tumors. (F) Percentage of tumors that stained positive for BMR1B. (G) Percentage of BMPR1B-positive tumor area for each tumor. Solid bars represent median values.
(H) IHC BMPR1B staining of mammoplasty tissue from two different healthy donors and luminal tumor tissue from two patients. Arrows indicate luminal (Lu) and myoepithelial (Myo/Bas) cells. Scale bar represents 20 μm.
(I) IHC BMPR1B staining of the same section of luminal tumor 1. (Left) Normal peritumoral tissue. (Right) Tumor tissue. Arrows indicate luminal (Lu) and myoepithelial (Myo/Bas) cells. Scale bar represents 20 μm.