
Figure 4.
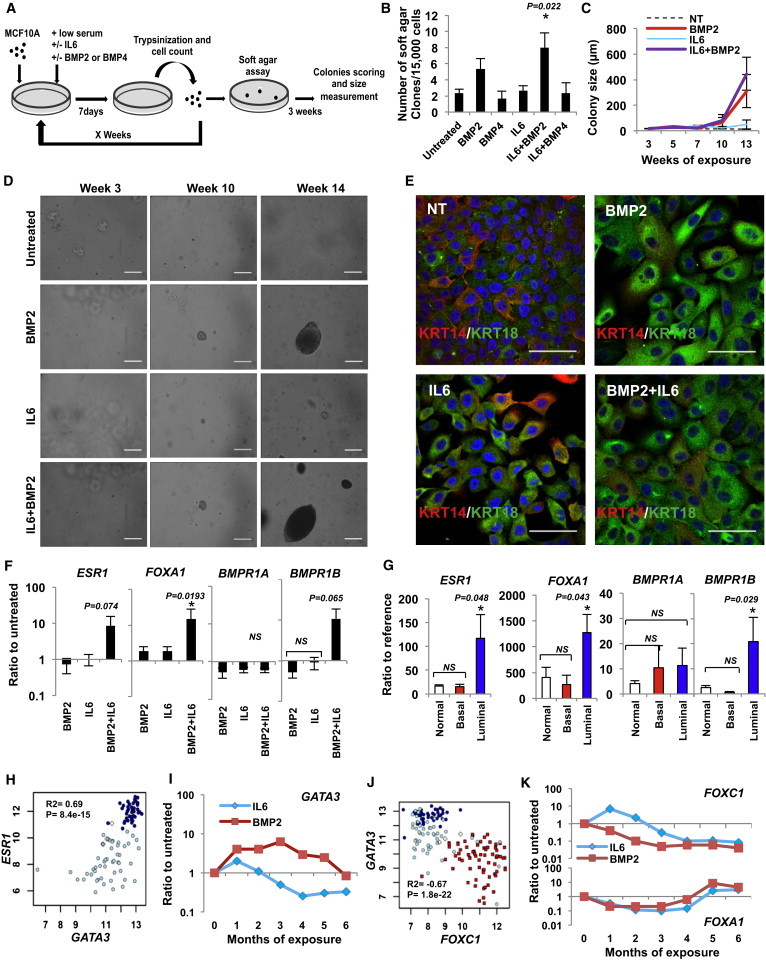
BMP2 Cooperates with IL-6 to Initiate Mammary Epithelial Cell Transformation
(A) Protocol representation: MCF10A cells were cultured for x weeks with chronic exposure to BMP2 or BMP4 ± IL-6 (10 ng/ml). Soft agar colony formation assays were performed at each passage and colonies were measured and counted after 3 weeks.
(B) Quantification of soft agar colonies at 14 weeks ± SEM, n = 6.
(C) Colony size corresponding to x weeks of treatment. Data are presented in μm ± SEM, n = 6.
(D) Bright-field images of soft agar clones after x weeks of BMP2 ± IL-6 treatment. Scale bar represents 200 μm.
(E) Immunofluorescent staining of MCF10A cells for keratin 14 (KRT14, red) and keratin 18 (KRT18, green) after chronic exposure to BMP2 ± IL-6. Scale bar represents 100 μm.
(F) qPCR analysis of ESR1, FOXA1, BMPR1A, and BMPR1B expression after 10-week BMP2 ± IL-6 treatment. Data represent the mean ratio to untreated cells ± SEM, n = 6, ∗p < 0.05. (B, C, and F) n indicates the number of independent experiments.
(G) qPCR analysis of ESR1, FOXA1, BMPR1, and BMPR1B expression in normal (n = 10), luminal (n = 16), and basal (n = 4) tumor samples; data represent the mean ratio to reference pool of mammary primary cells ± SEM, ∗p < 0.05.
(H and J) Microarray analysis of (H) GATA3 versus ESR1 expression in 92 FOXA1-positive tumors. (J) FOXC1 versus GATA3 expression in normal samples (white diamonds), basal (red squares), luminal (dark blue circles), and apocrine tumors (light blue circles). Pearson’s values of statistical testing R2 and p values are presented.
(I and K) Time course representative of six independent experiments of (I) GATA3 or (J) FOXA1 (upper) and FOXC1 (lower) expression in BMP2 versus IL-6-treated cells.