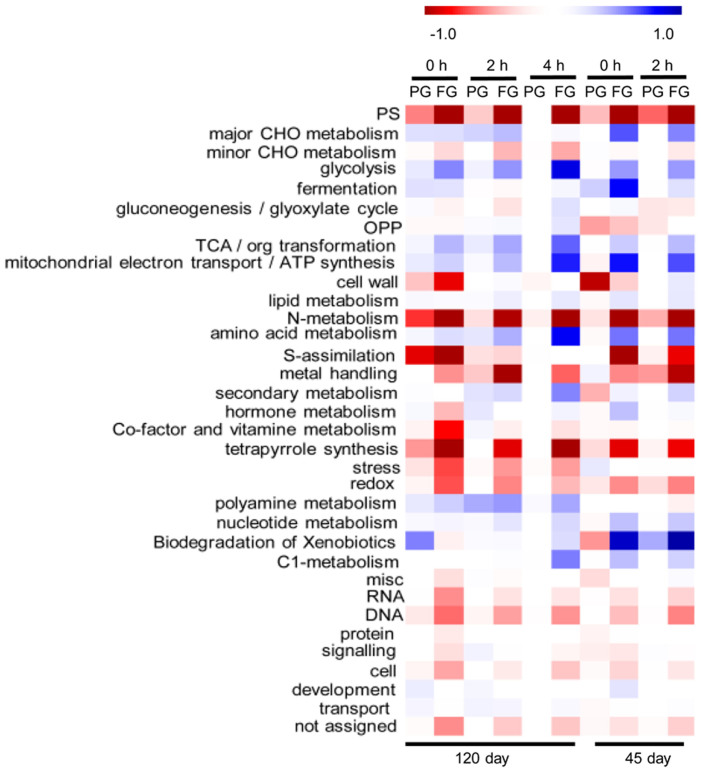
Figure 2. A heat map showing under and over represented functional classifications among genes which were differentially regulated in partial girdled (PG) and fully girdled (FG) cassava leaves.
This analysis was performed using the Pageman software package http://mapman.gabipd.org/web43. Red boxes indicate that genes in a category were generally down-regulated in the corresponding set of samples relative to controls while blue boxes indicate that genes in a category were generally up-regulated in the corresponding set of samples. Fisher's exact test was applied to test for enrichment of functional category and FDR was controlled for by Benjamini and Hochberg's procedure at P = 0.01.

