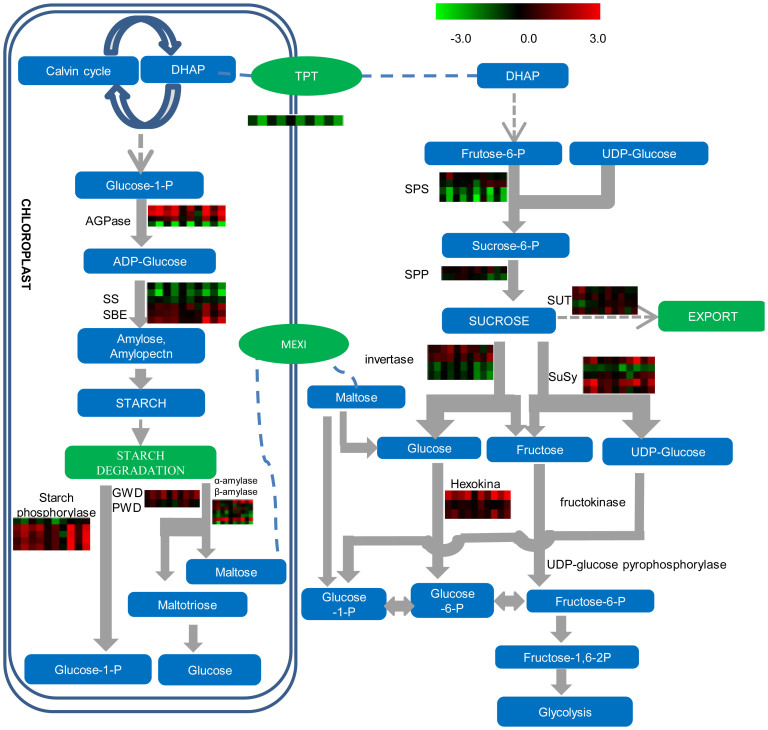
Figure 5. Effects of girdling on the expression of genes associated with starch and sucrose metabolism pathways.
The values in red and green indicate log2 fold increases and decreases, respectively, in expression in partial girdled (PG) and fully girdled (FG) leaves compared to control leaves. Each row represents the expression pattern of a specific gene. Each column represents a different experimental condition. Experimental conditions 1–6 (left to right) are leaves from 120-day-old plants that were developing storage roots: (1) 0 h PG leaves, (2) 0 h FG leaves, (3) 2 h PG leaves, (4) 2 h FG leaves, (5) 4 h PG leaves, and (6) 4 h FG leaves; conditions 7–10 (left to right) are leaves from 45-day-old seedlings that have no storage roots developed: (7) 0 h PG leaves, (8) 0 h FG leaves, (9) 2 h PG leaves, and (10) 2 h FG leaves.

