
Figure 5. Effects of exogenous EGR1 expression in type 1 cells.
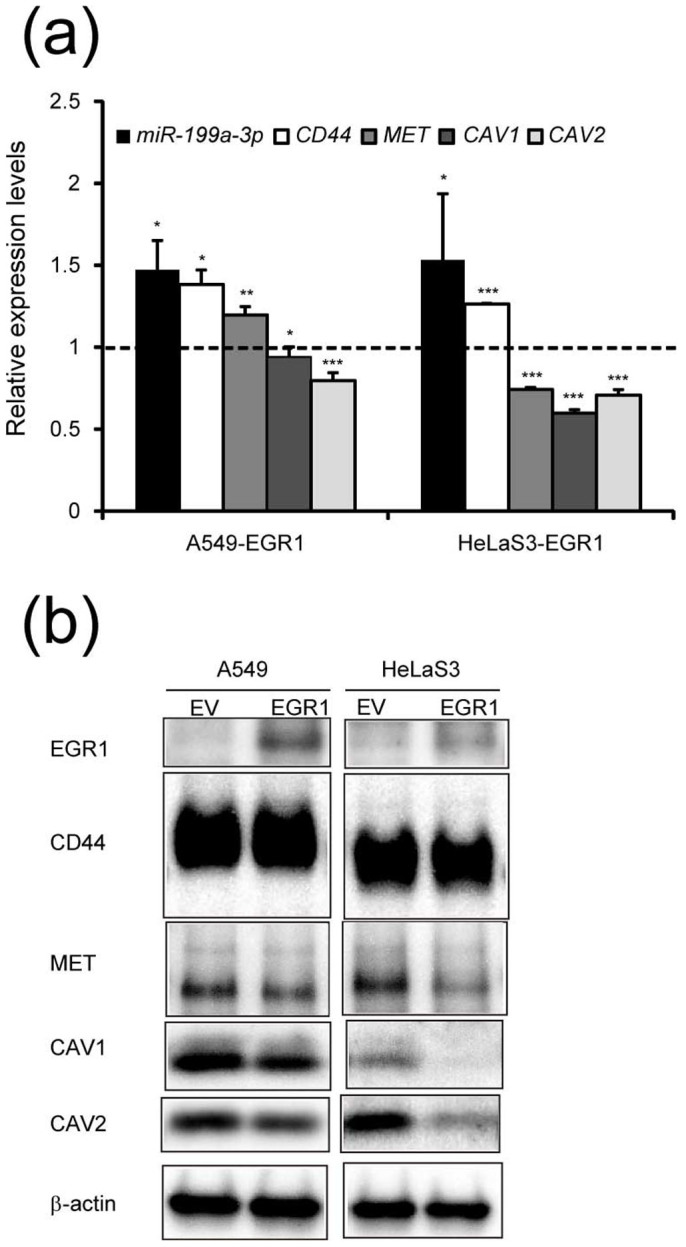
(a) Relative expression levels of miR-199a-3p and type 1-specific mRNAs were determined by quantitative RT-PCR in A549 and HeLaS3 cells which were transduced with retroviral vectors expressing EGR1. The expression levels of cells transduced with empty vector was taken as 1.0. The data represent the means ± S.D. (n = 3). Asterisks indicate P value, compared with those transduced with empty vector. *P<0.05, **P<0.01, ***P<0.001 (b) Analysis of type 1-specific gene products and EGR1 in the parallel cultures prepared in a by western blotting. β-actin was used as the loading control. The full-length blots were presented in the supplementary Figure 8 and relative expression levels of each protein including two additional sets of blots were quantified in Supplementary Table 2.