
Figure 5. HBV replication induces oxidative stress as manifested by consumption of GSH.
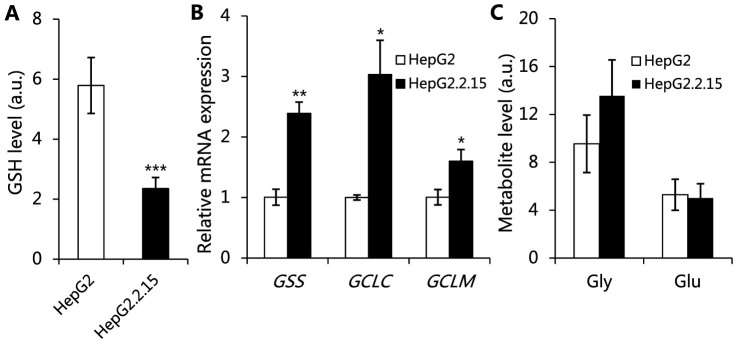
(A) The levels of GSH in HepG2.2.15 and HepG2 cells, data are shown as mean ± s.d., n = 10, t-test, ***P < 0.001. (B) The mRNA levels of enzymes involved in GSH biosynthesis in HepG2.2.15 and HepG2 cells, Data are shown as mean ± s.d., n = 3, t-test, *P < 0.05, **P < 0.01. (C) The relative levels of glycine and glutamate in the cell detected by 1H NMR, data are shown as mean ± s.d., n = 10, t-test, P > 0.05.