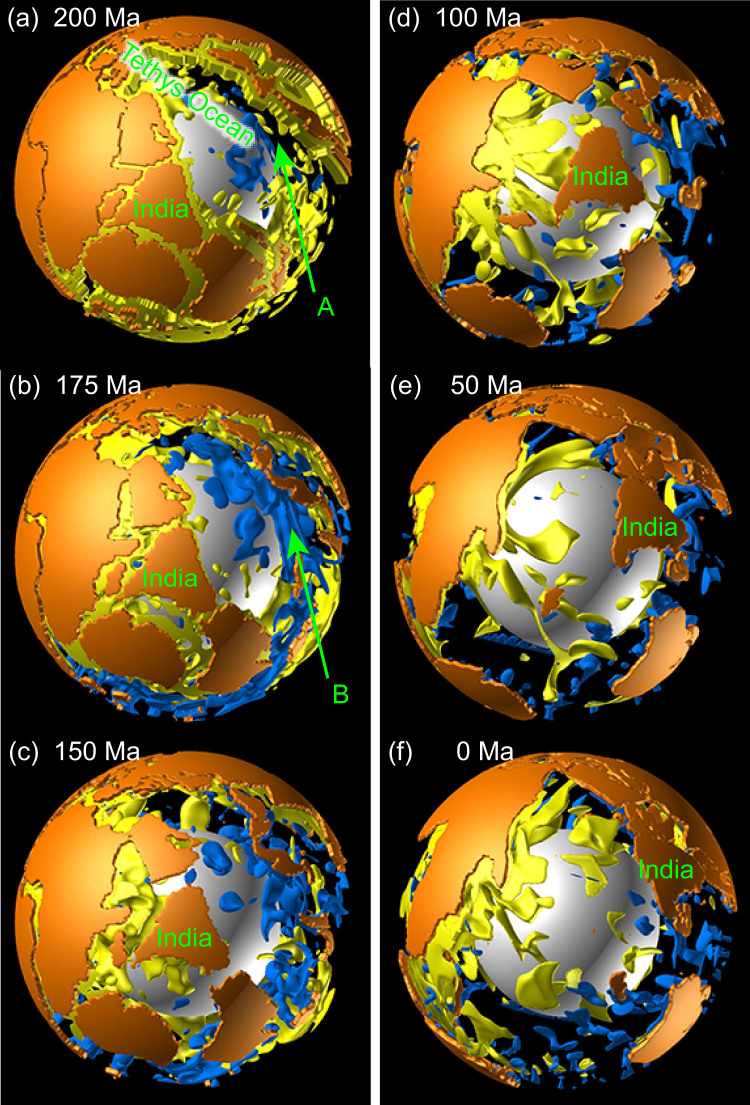
Figure 3. Time sequence of 3-D views of mantle convection and drifting continents for Model C30 with ΔηC = 103.
The cyan and yellow isosurfaces of the temperature anomaly (i.e., the deviation from the laterally averaged temperature at each depth) indicate −250 K and +100 K, respectively. The isosurfaces of the temperature anomaly at depths of less than 202 km are omitted for clarity. Positions of the continents are represented by orange regions. White sphere indicates the bottom of the mantle. This figure was produced using the commercial visualization software AVS/Express.

