
Figure 2.
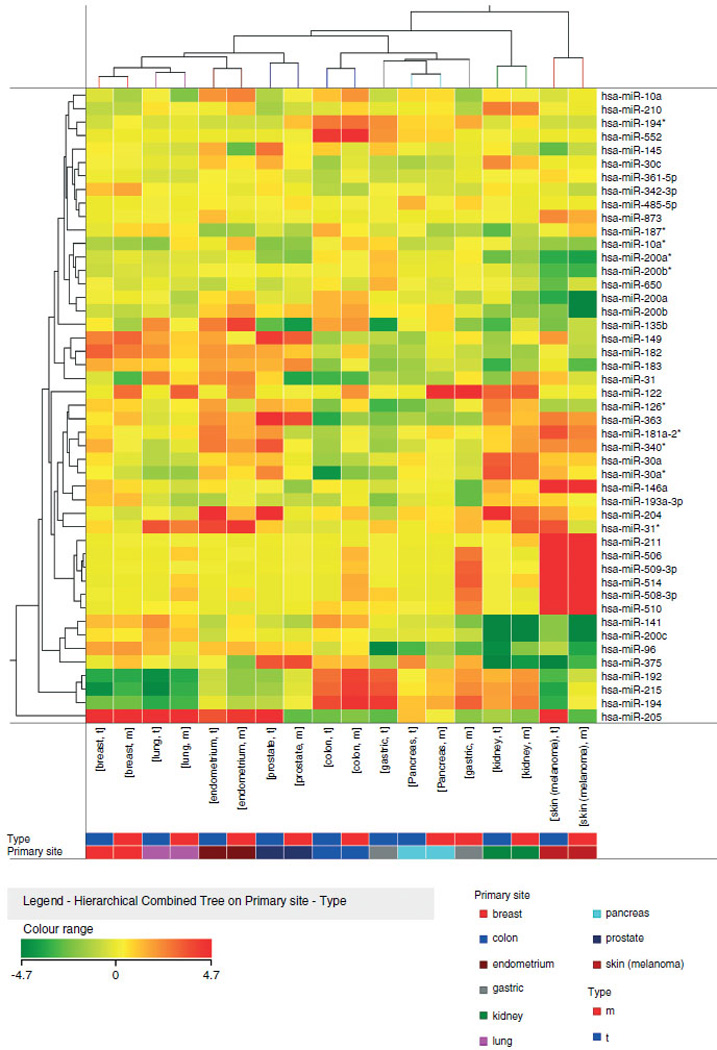
Average expression of 47 miRNAs in primary and metastatic tumours. Heat-map representation of the average expression of 47 miRNAs in metastatic and primary carcinomas from ten different tissues. Metastases and primaries from the same origin exhibit highly similar miRNA expression and are grouped together. The colours of the genes represented on the heat map correspond to the expression values normalized on miRNA mean expression across all samples: green indicates down-regulated; red indicates up-regulated in the tissue.