
Fig. 4.
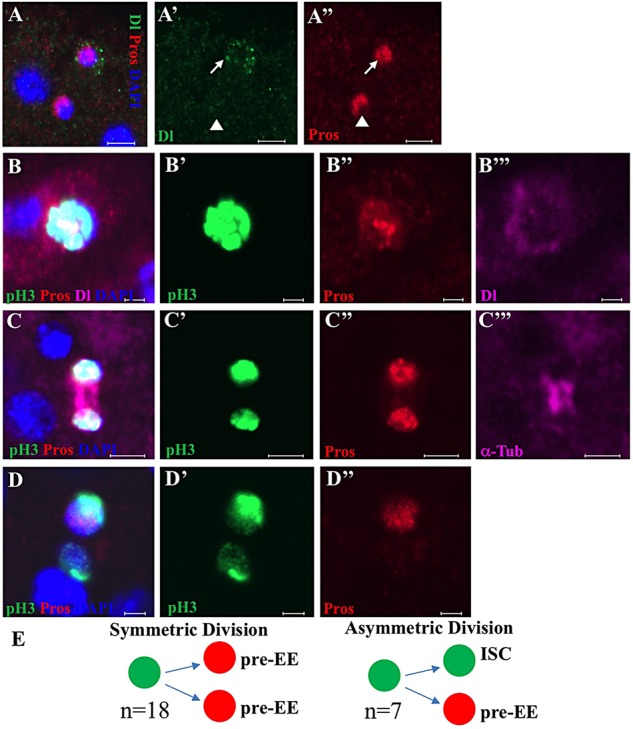
EE generation during ISC division. (A-A″) A representative image showing a Dl+ Pros+ pre-EE cell (arrows) and Dl− Pros+ EE cell (arrowheads). (B-B‴) Representative images of a pH3+ Pros+ Dl+ cell in the posterior midgut of wild-type flies. (C-C‴) Representative images showing an ISC becoming two pre-EEs through symmetric division. α-Tubulin was used to label the spindle of the dividing cell. (D-D″) Representative images showing an ISC becoming a new ISC and a pre-EE through asymmetric division. In all images, the 1-week-old wild-type flies were stained using the antibodies indicated. Scale bars: 2 μm. (E) Schematic showing the quantitation of EE generation from ISCs through symmetric and asymmetric division in the posterior midguts of wild-type flies.