
Figure 2.
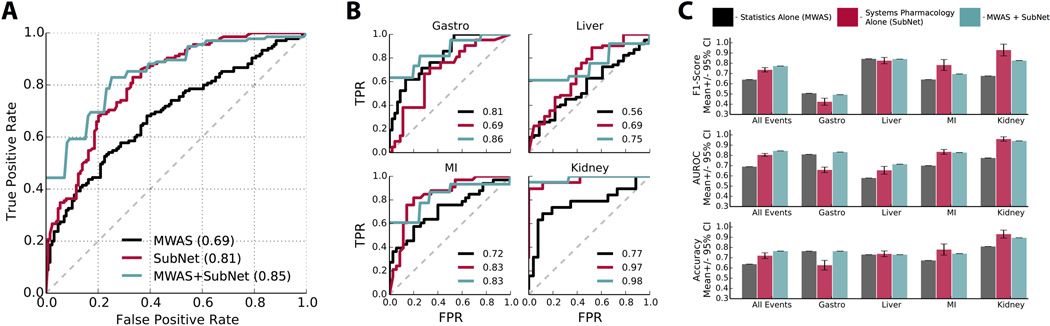
Systems pharmacology data significantly improve drug safety predictions. (A) Receiver operating characteristic (ROC) curve showing performance of pharmacovigilance statistics (MWAS) alone, systems pharmacology (SubNet) alone, and MWAS+SubNet for four adverse events (AEs) combined. The true positive rate, or sensitivity, is plotted against the false positive rate, or 1-specificity. Area under the ROC curve (AUROC) is indicated in parentheses; an AUROC of 0.50 is equivalent to random classification and 1 represents perfect classification. MWAS+SubNet performs significantly better than MWAS alone. (B) ROC curves demonstrating performance for individual AEs: gastrointestinal bleeding (Gastro), acute liver failure (Liver), acute myocardial infarction (MI), and acute kidney failure (Kidney). AUROCs for MWAS alone (black), SubNet alone (red), and MWAS+SubNet (green) are indicated. (C) Quantification of classifier performance using the commonly applied metrics of F1 score (measuring classifier precision and recall), AUROC, and accuracy.