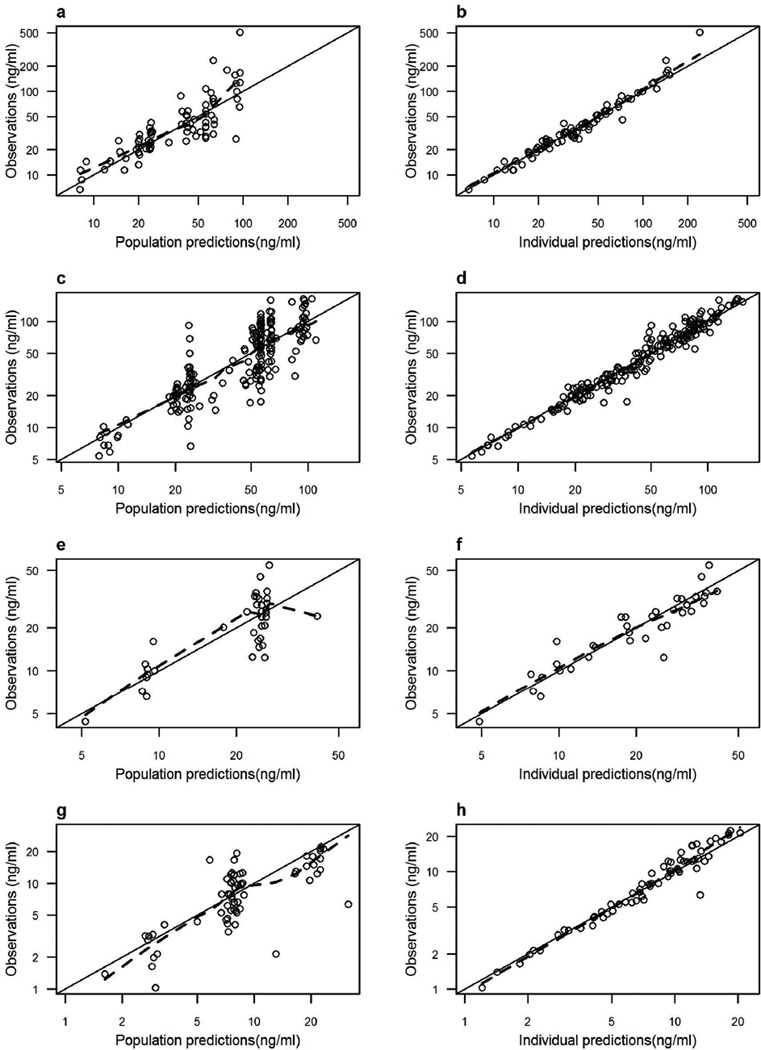
Figure 2.
Plot of ondansetron observed versus the final pharmacokinetic model population predicted (left panel) and individual predicted (right panel) concentrations in non-pregnant women (a and b), pregnant women (c and d), cord blood (e and f), and neonates (g and h). The solid line is the line of identity. The dashed line is a lowess smother. The observed concentrations, population predictions, and individual predictions were transformed into their logarithms.

