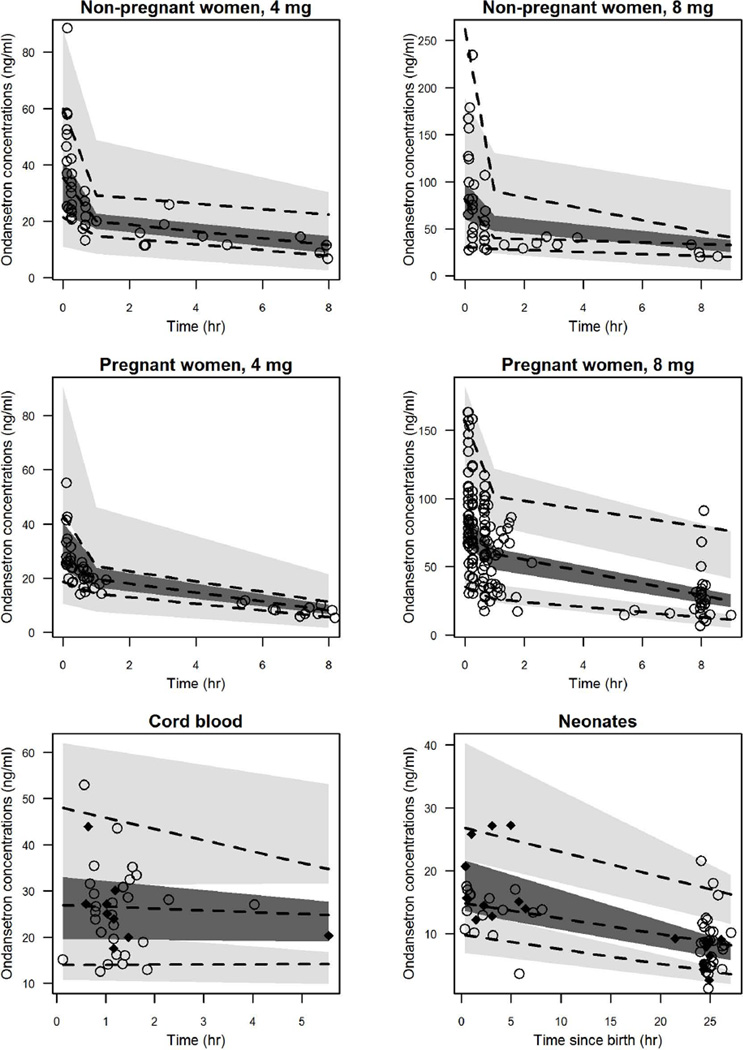
Figure 4.
Visual predictive check of the final pharmacokinetic model for ondansetron concentrations non-pregnant women, pregnant women, cord blood, and neonates. Dashed lines represent the 5th, 50th, and 95th percentile of observed concentrations. Shaded areas represent the 95% CI for the 5th, 50th, and 95th percentile of simulated concentrations. Points represent the observed concentrations. Observations in cord blood and neonates were prediction-corrected. In cord blood and neonatal plots, closed squares and open circles represent observations following administration of the 4 mg and 8 mg doses to the mothers, respectively.

