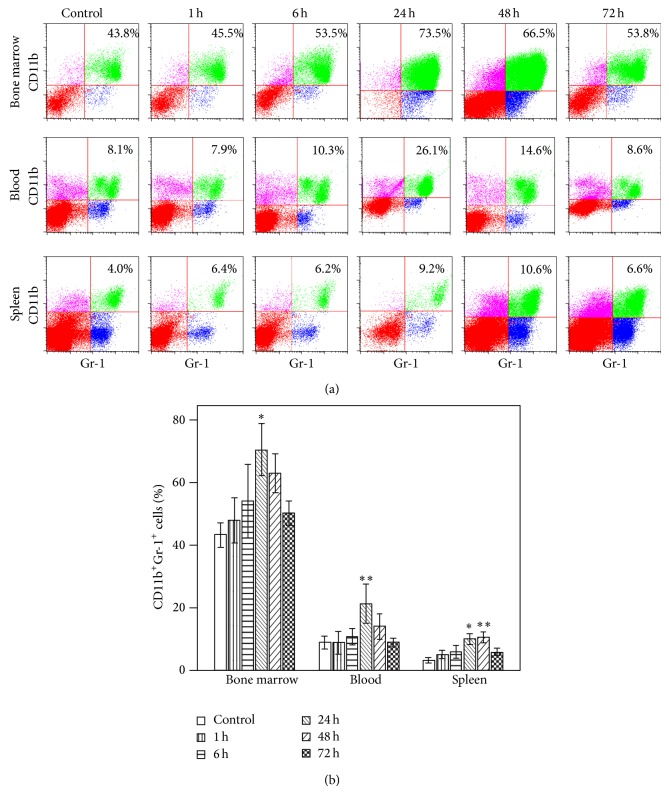
Figure 1.
Time course of the changes in accumulation of CD11b+Gr-1+ myeloid-derived suppressor cells (MDSCs) after pseudofracture (PF) in mice. (a) Representative flow cytometric analysis and (b) graphic analysis of the percentages of CD11b+Gr-1+ cells in bone marrow cells, blood leukocytes, and splenocytes in mice at time points after injury. * P < 0.05; ** P < 0.01 versus control time point. Data represent means ± SEM; n = 3 mice per time point.

