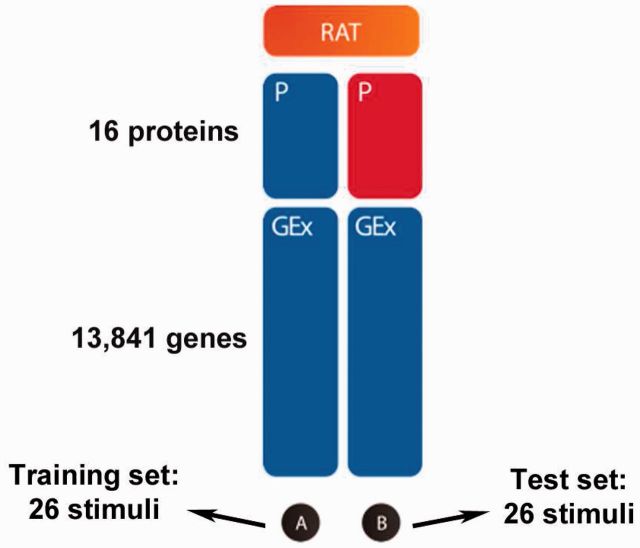
Fig. 1.
Overview of SC1. Participants were provided with gene expression (GEx; measured via microarrays) and protein phosphorylation (P; profiled with Luminex xMAP) data from Subset A of stimuli in rat for training. Participants were asked to predict which proteins show changes in their phosphorylation status for each stimulus in Subset B (test data) in rat, using gene expression data measured later in time from cells treated with the same stimuli. Blue indicates available data, while red indicates hidden data

