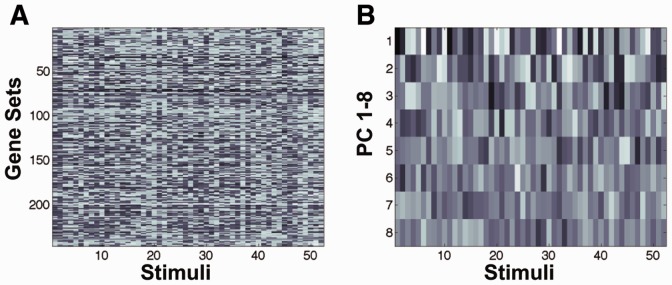
Fig. 3.

PCA of the training data. (A) The gene set enrichment data (NES score) of the 246 rat genes (rows) as a function of the 52 stimuli (columns) used in the experiments. (B) The first eight principal components of the data in (A). The first principal component clearly shows the largest variation over the stimuli. The variation decreases for higher ranked components
