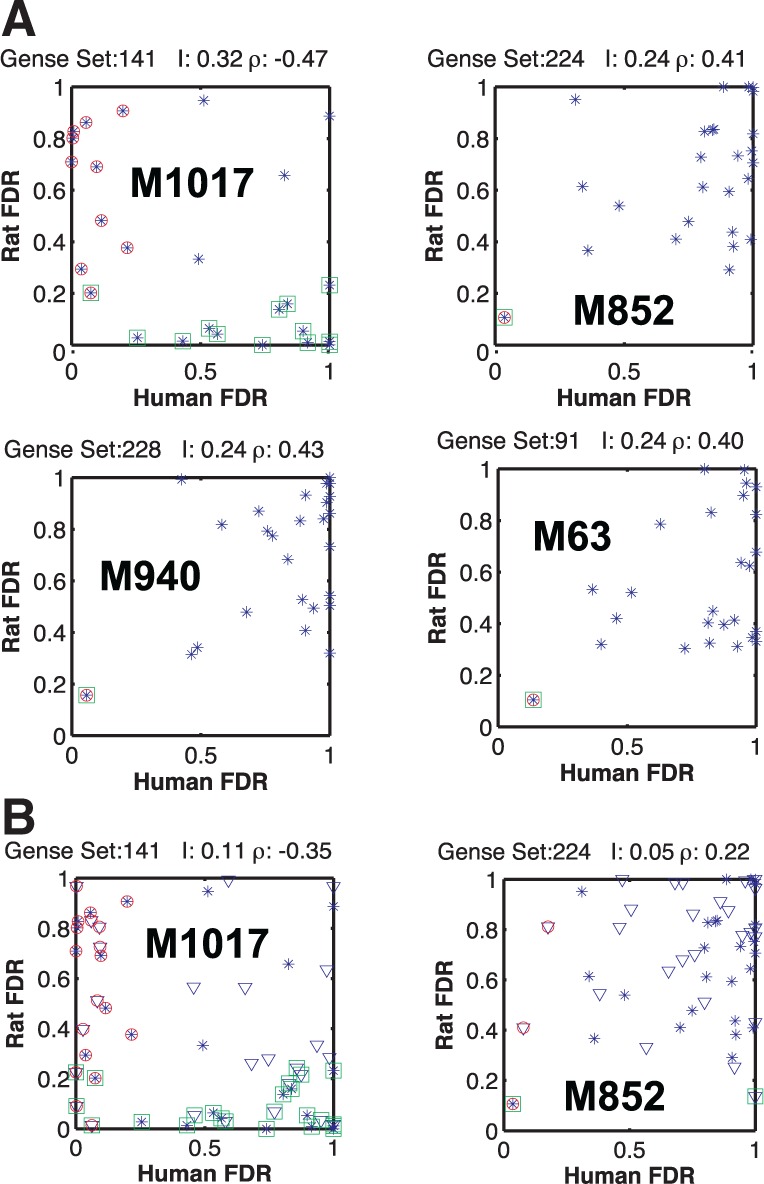
Fig. 4.

Comparing the correlation between gene sets of human and rat. (A) The rat versus human FDR scores of a given gene set are shown for the 26 stimuli in set A (blue dots). Stimuli with expression levels significantly different from those in control are marked with green squares for rat and red circles for human. When the two markers overlap, that particular stimulus results in a similar response in the two species. The highest MI is surprisingly between gene sets that are negatively correlated. In general, the correlation is lower than the intra-species gene and phosphorylation or the inter-species phosphorylation patterns. The legend above each subplot shows the inter-species MI I and the Pearson correlation coefficient ρ. The gene sets shown are M1017, DNA replication; M852, NFκB activation by TAK1 through phosphorylation and IKKs complex; M940, NFκB activation by TRAF6; M63, osteopontin-mediated events (Subramanian et al., 2005). (B) The first two gene sets, with the additional 26 stimuli of the test set also, shown (triangles). M1017 remains the gene set with the highest inter-species MI through anticorrelation. Although MI is lower, the statistical significance is not diminished
