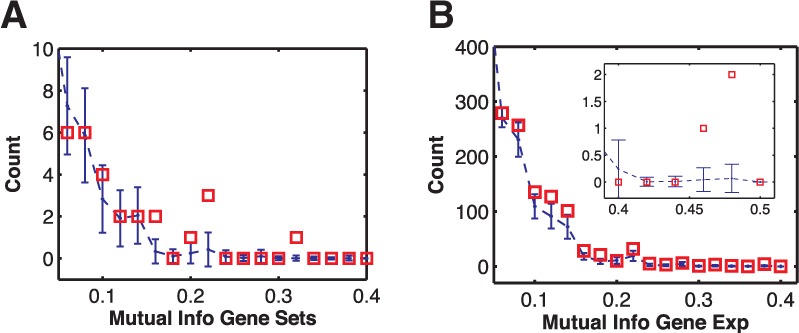
Fig. 6.

Histogram of the MI for gene set pairs (A) and ortholog genes (B) in bits. (A) The blue dots with error bars are the mean and standard deviation of counts (of 246 gene sets) obtained from computing MI over randomized datasets. The MI of the actual gene sets at 0.24 and 0.32 (refer to Fig. 4) exceeds the values expected by chance at (P < 0.05). (B) Histogram of the MI of ortholog genes (counts are out of 13 841 genes). The ortholog genes do not exhibit a significantly higher MI compared with the gene sets. In fact, because of high number of genes compared with gene sets, it is more likely that high MI in ortholog genes is due to chance
