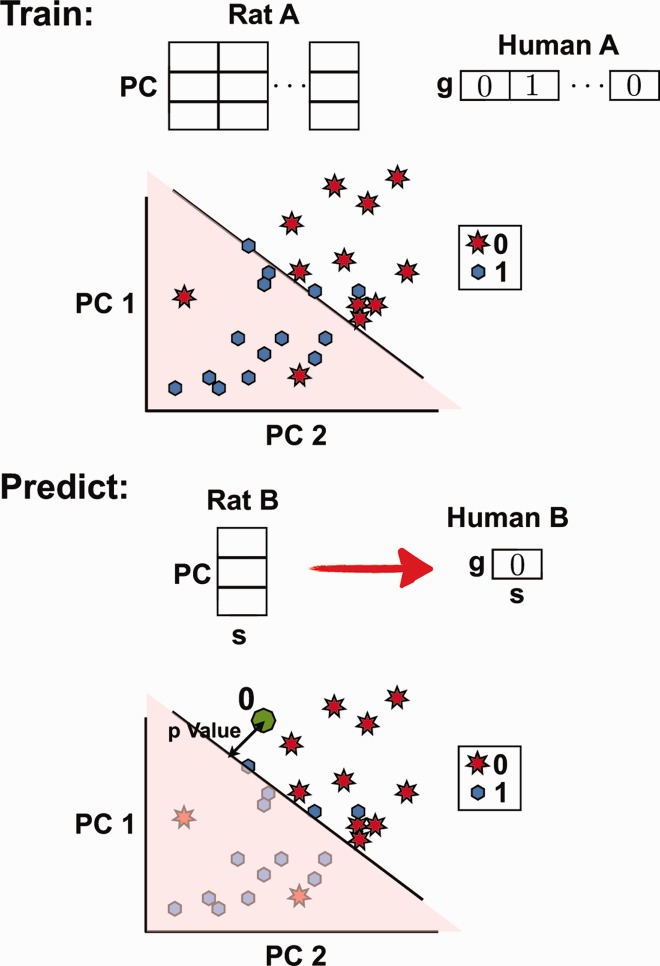
Fig. 8.
Schematic of the classification protocol. (Top) Training the algorithm to predict gene set g in human under stimulus s. First, represent the rat NES scores under the 26 stimuli of set A as 26 points in N-dimensional space, where N is the number of principal components used. The figure shows a diagram for N = 2. We used N = 8 for the actual prediction. Label each of the 26 points as either 0 (off) or 1 (on) based on the human FDR value of gene set g under the same 26 stimuli. Next, identify the hyperplane that best separates the two types of labels. (Bottom) Predicting gene set g under stimulus s of set B. Introduce a new point corresponding to the reduced representation of rat NES score under stimulus s. Depending on which side of the hyperplane the point falls on and its separation distance from the plane, classify as either 0 and 1 and associate a statistical significance

