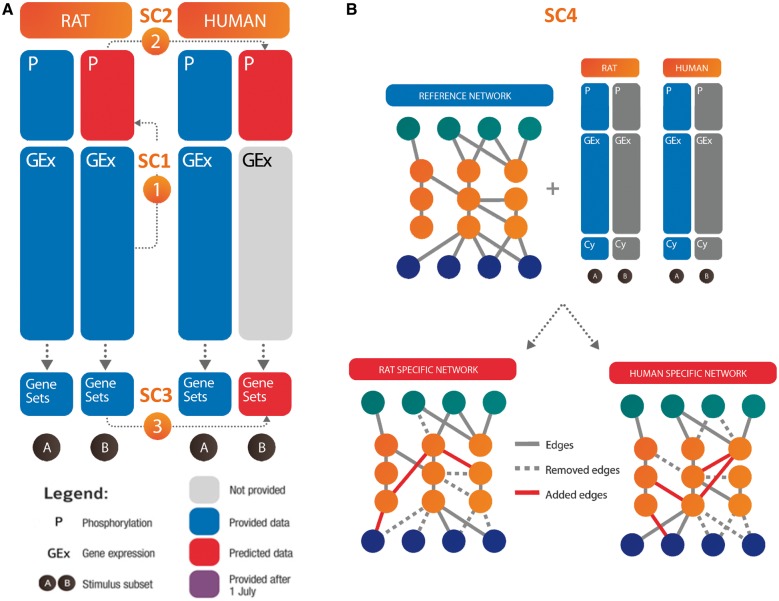
Fig. 1.
Overview of the STC: (A) Schematic of predictions to be made for each sub-challenge. Each sub-challenge required the prediction of the different sets of responses, indicated in red. (B) Schematic of SC4 to indicate utilization of a provided reference network with species-specific information from the training dataset to generate species-specific networks through the addition and removal of edges. Though cytokine measurements were made available to participants, they were not used in scoring, and for simplicity, were not included in this overview figure

