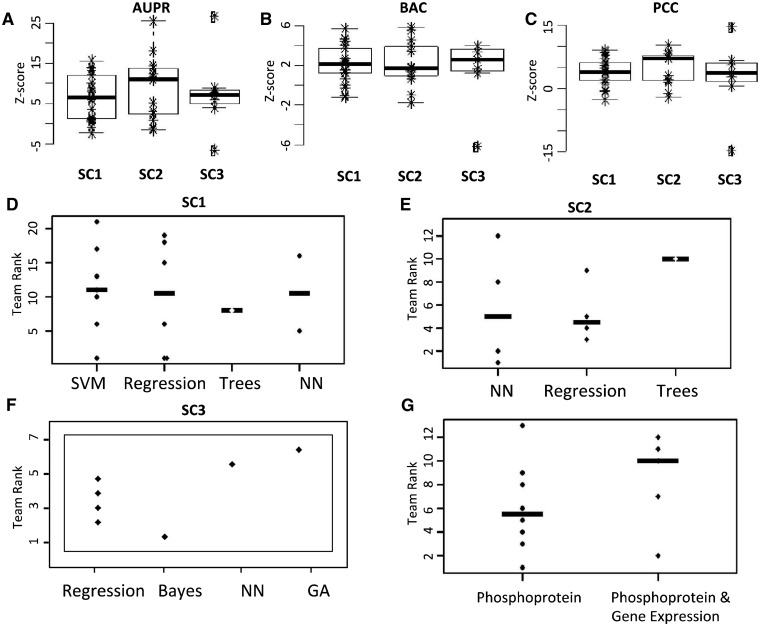
Fig. 2.
Scores and computational methods used for solving the STC. The null hypothesis simulation was used to compute and plot team Z-scores of AUPR curve, balance accuracy (BAC) and PCC for SC1 (A), SC2 (B) and SC3 (C). Z-scores are used to compare the apparent difficulty of each of the sub-challenges. Panels (C–G) reflect actual performance differences—as measured by overall rank of three metrics—for different methodological approaches. Teams’ rank distributions are plotted separately by the type of approach for SC1 (D), SC2 (E) and SC3 (F). (G) In SC2, teams’ rank distribution is separated by usage of solely protein phosphorylation data or in combination with gene expression data. SVM: support vector machines, Trees: random forest and other tree-based methods, NN: neural networks, GA: genetic algorithm

