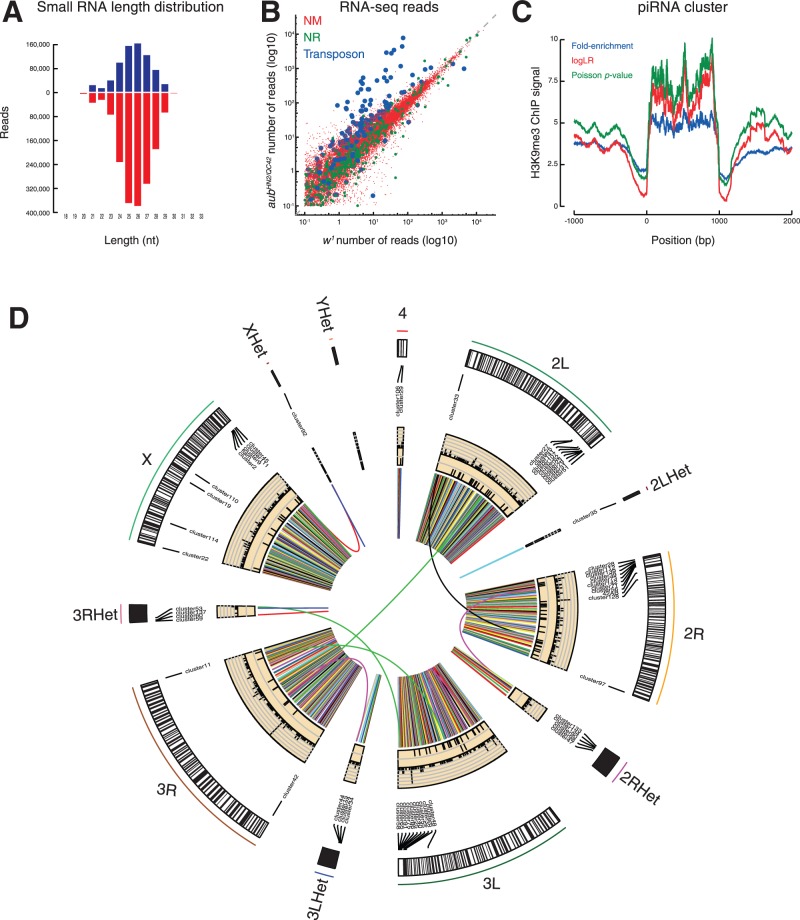
Fig. 1.
Gallery of piPipes Figures (A) Barplot representing length distribution of Drosophila w1 ovary small RNAs assigned to sense (blue) and antisense (red) strands of transposons. (B) Scatterplot comparing w1 to aubHN2/QC42 Drosophila ovary RNA-seq reads assigned to mRNA (NM; red), non-coding RNA (NR; green) and transposons (blue). (C) Metagene plot of H3K9me3 ChIP-seq of piRNA clusters from flies in which piwi mRNA was depleted by double-stranded RNA-triggered RNA driven by a triple Gal4 driver (SRX215630). (D) Circos plot representing the locations of, from the periphery to the center, cytological position, piRNA clusters, SV discovered by TEMP (tiles), retroSeq (tiles) and VariationHunter (links) using genomic sequencing of 2–4-day-old ovaries

