
Fig. 6.
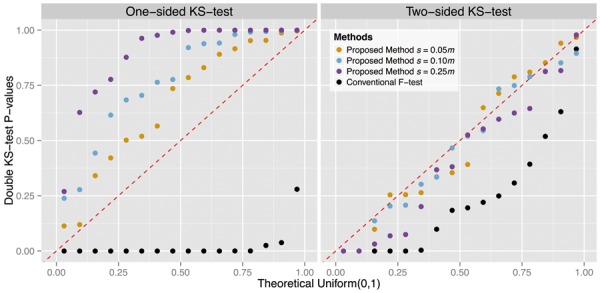
QQ-plots of double KS test P values from 16 simulation scenarios versus the Uniform(0,1) distribution. For each of 500 independent studies per scenario, we tested for deviation of null P values from Uniform(0,1), resulting in 500 KS test P values for each scenario. An individual point in the QQ-plot represents a double KS test P value for one scenario, comparing its 500 KS test P values to Uniform(0,1). On the left panel, the systematic downward displacement of 16 black points indicates an anti-conservative bias of the conventional F-test. In contrast, the proposed method produces null P values that are not anti-conservative. On the right panel, a set of 16 points are below the diagonal red line if the joint null distribution deviates from the Uniform(0,1) distribution. The proposed method adjusts for over-fitting of PCA and produces accurate estimates of association significance