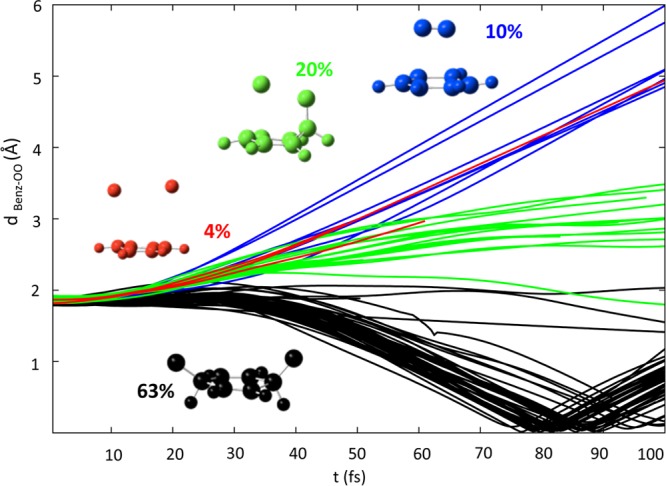
Figure 5.

Time evolution of the dBenz–OO distance for different groups of trajectories. In black, trajectories leading to O–O homolysis, in blue the ones producing B+1O2 and other products in red and green. Percentages for the different products are specified.
