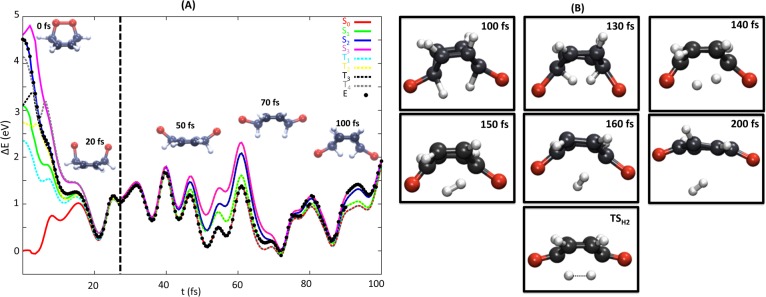
Figure 7.

(A) Time evolution of a representative trajectory leading to BQ + H2 products. Singlet states are represented as solid lines, (S0 in red, S1 in green, S2 in blue, and S3 in pink), while triplet states are denoted with dotted lines in light blue T1, yellow T2, black T3, and gray T4. Black points indicate the current potential energy of the system at each time. The vertical dotted line in black in panel A indicates the point when the trajectory reaches the S0 and the energy scaling is switched off. (B) Snapshots for longer propagation times and the optimized geometry of the TSH2 for comparison. Note that for this trajectory deuterium atoms where replaced by hydrogens (see text).
