
Figure 7.
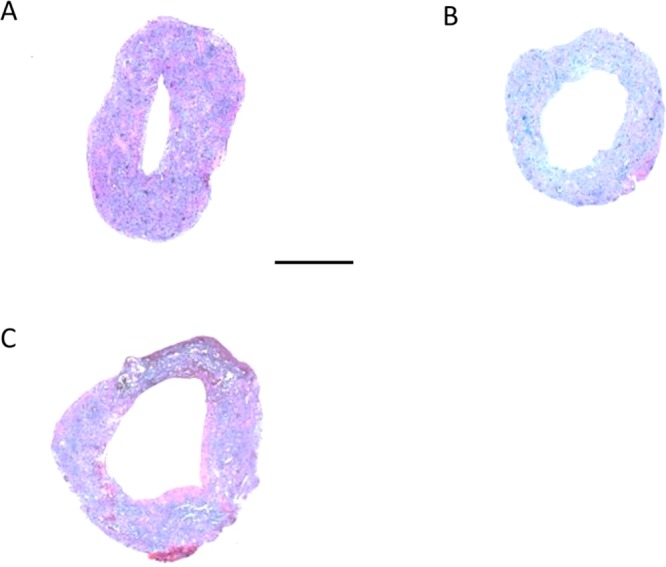
Cross sectional of TEVGs after implantation: (A) control, (B) VEGF, and (C) anti-CD34Ab. These representative cross sections demonstrate the visible difference in reduced diameter of the control (A) compared to the modified grafts (B, C) two weeks after implantation, as well as the tissue and extracellular matrix formation within the grafts. Scale bar represents 500 μm.