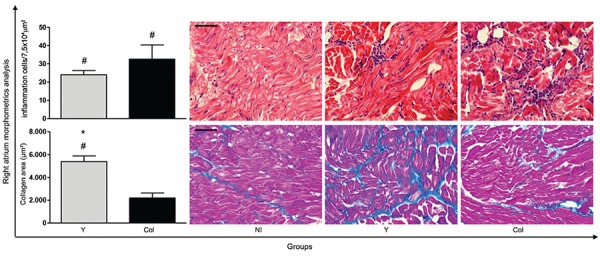
Fig. 4. : morphometric analysis and photomicrographs of the heart showing the number of inflammation cells (haematoxylin and eosin) and fibrosis area (Masson trichrome) at 240 days after infection with Y strain (Y) or Colombian strain (Col) of Trypanosoma cruzi. The results are expressed as mean number of cells or collagen area ± standard error. Significant differences at p < 0.05 are indicated by the symbols # for comparison between the non-infected group (NI) and infected groups (Y or Col) and * for comparison differences between Y and Col groups at each time point. Bar = 50 μm.