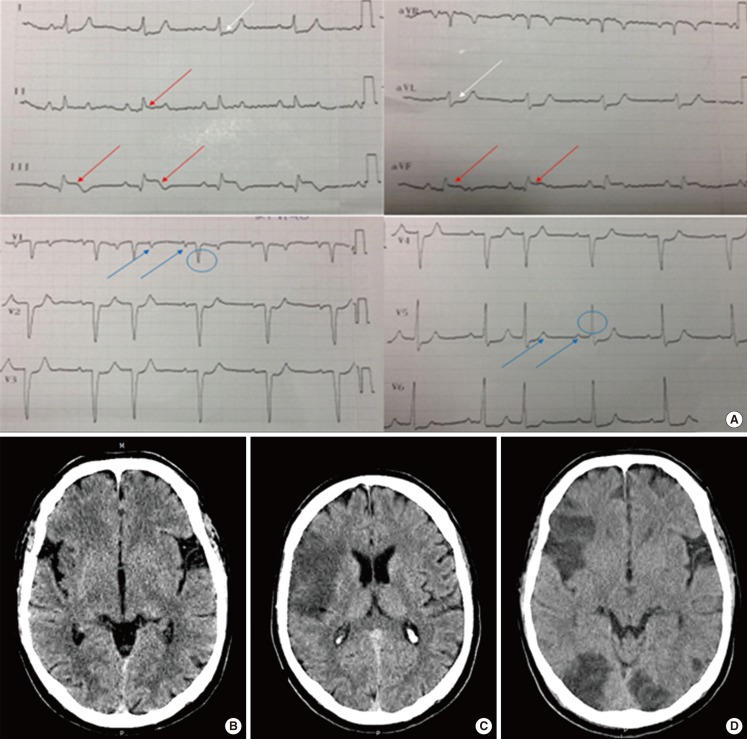
Figure 1.
(A) Electrocardiogram showing sinus rhythm, with 2:1 conduction block; two p waves (blue arrows) and one QRS wave (blue circle) are shown. ST elevation is visible in leads II, III, and aVF (red arrows), with ST depression in leads I and aVL (white arrows). (B) Brain CT showing early signs of acute stroke (insular ribbon sign and hemispheric sulcus effacement) in the right MCA territory. (C) Established stroke in the cortical territory of the right MCA. (D) Additional bilateral ischemic stroke in the posterior territory.

