Figure 3.
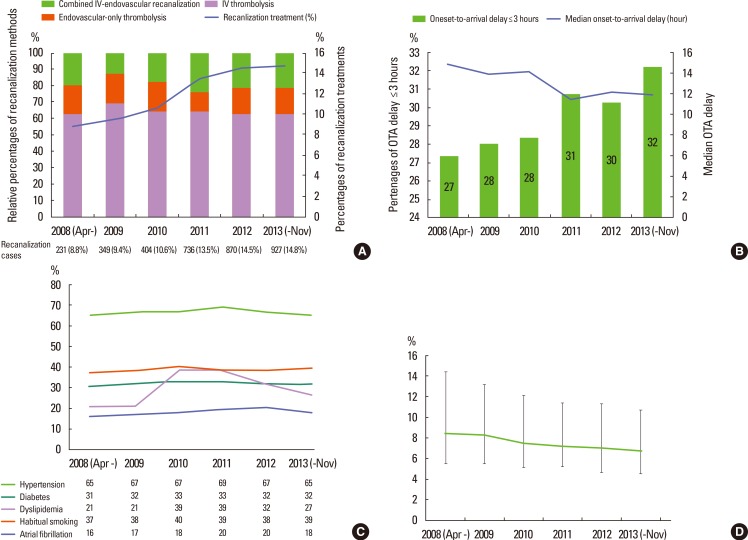
Temporal trends of selected variables over 5.5 years of the CRCS-5 registry. Temporal trends of recanalization treatments in the CRCS-5 registry over the 6 years (A). The relative proportions of IV thrombolysis (purple bar), endovascular-only recanalization (orange bar) and combined IV-endovascular recanalization (green bar) remained stable during the inclusion period (bar graph). However, the proportion of recanalization-treated cases consistently increased in the registry from 8.8% (231 cases) in 2008 to 14.8% (927 cases) in 2013 (line graph). Temporal trends of onset (last seen normal) to arrival delay over the 6 years in the CRCS-5 registry (B). The proportions of early arrivals within 3 hours of onset steadily increased (bar graph) and the median onset to arrival delay were lowered from 14.8 hours in 2008 to 11.9 hours in 2013 for the entire population of CRCS-5 registry. Temporal trends of vascular risk factors in CRCS-5 registry (C). Overall, the percentages of risk factors did not demonstrate noticeable changes over the recruitment period. Temporal trends of median hospitalization duration over the 6 years, decreasing from 8.4 [5.5-14.4] days in 2008 to 6.7 [4.5-10.7] days in 2013 (D). The upper and lower error bars represent the 75th and 25th percentiles, respectively. OTA, onset-to-arrival.

