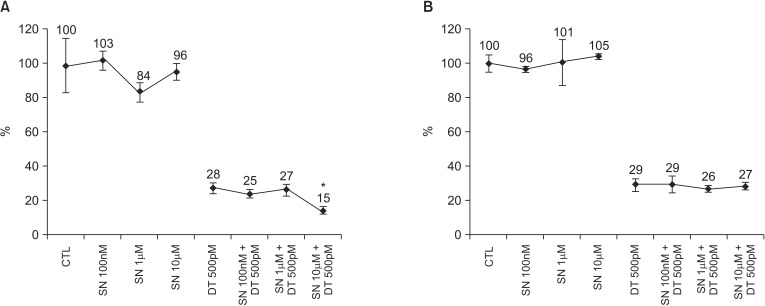
Fig. 1.
Cell growth after combined treatment of docetaxel at 500pM and selenium at 100nM, 1µM, or 10µM in the MDA-MB-231 cell line (A) and the MCF-7 cell line (B). Cells were stained with trypan blue to determine cell viability and were quantified using a hemocytometer. Relative cell growth rates are shown as percent survival versus indicated cells after treatment with the drug at different concentrations. The data represent the means of at least three independent experiments and the corresponding standard errors. *P-value less than 0.05.

