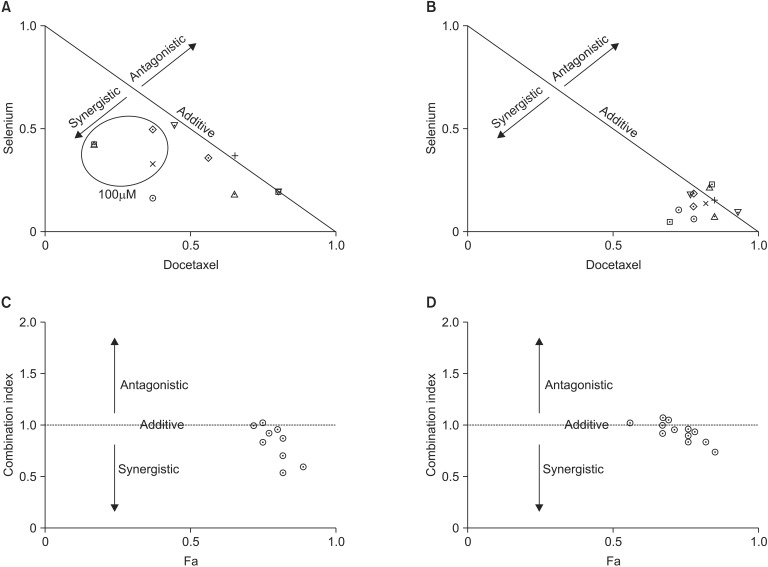
Fig. 2.
Normalized isobologram for selenium and docetaxel in the MDA-MB-231 (A) and MCF-7 (B) cell lines. Diagonal experimental combination data points, represented by dots located lower left, on the diagonal line, or upper right, indicate synergism, additivity, and antagonism, respectively. Fractional affected-combination index (Fa-CI) plot in combination index analysis in the MDA-MB-231 (C) and MCF-7 (D) cell lines. Combination index values <1, =1, or >1 indicate synergism, additivity, and antagonism, respectively.

