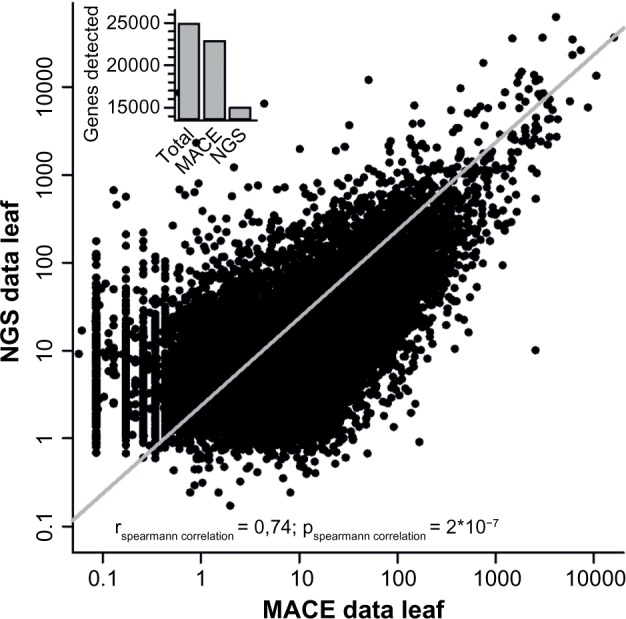
Figure 1.

NGS and MACE comparison. Comparison of MACE and NGS data for leaf tissue. The line indicates the Spearman correlation for both leaf expression datasets using RNA-seq and MACE. The inset gives the number of genes assigned in the genome, detected by MACE and detected by NGS, and depicts the higher coverage achieved by MACE.
