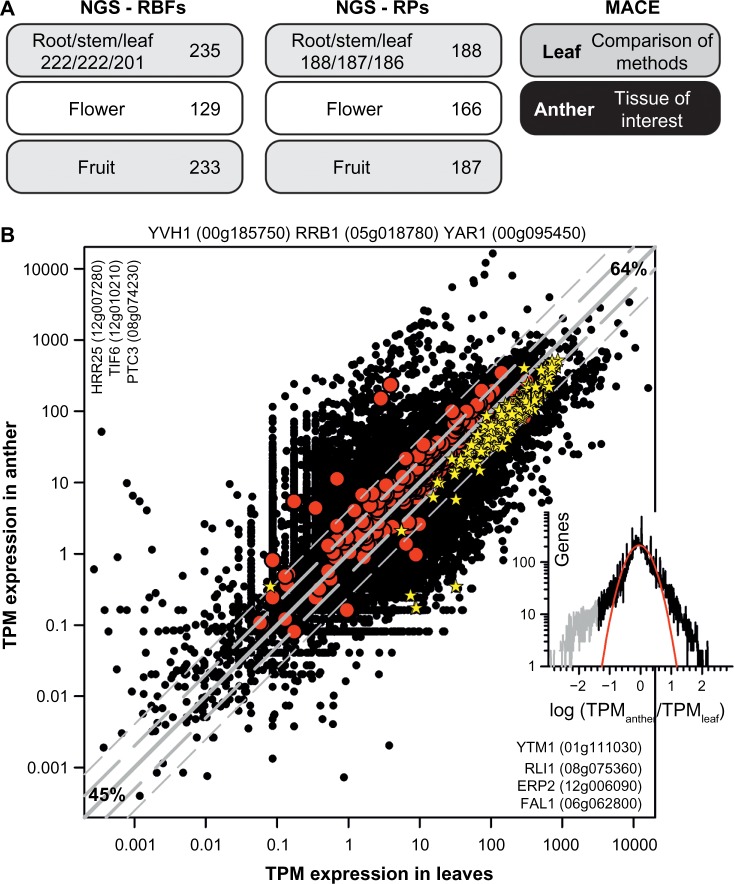
Figure 6.
The overall expression profile of RBF and RP (co-)orthologs in tomato. (A) Tissues used for NGS RNA-seq analysis (left) and the number of RBFs for which expression is detected in a least one tissue (beside) or in the individual tissue (below). On the right, the tissues analyzed by MACE in this study are indicated. (B) Relation of the TPM expression value in leaves and anthers for all genes (black circles), for all RBF genes (red circles), and for all RP genes (yellow star). Gray line indicates identical expression in leaves and anthers, the long dashed gray line expression with two-fold change, and the short dashed gray line expression with four-fold change (45% genes with less than two-fold change; 64% with less than four-fold change of expression). Indicated are RBF genes not expressed (top), expressed only in leaves (left) or anther (right). Inset on the right shows the distribution of the expression difference between leaf and anther. The gray section indicates a pool of genes with significantly higher expression in anthers, and the red line shows the least square fit analysis to a Gaussian equation.

